A graph, or coordinate plane, can be used to represent the results of equations by plotting their inputs and outputs. Basically, a value is inputted into an equation (with one variable), a series of mathematical actions occur, and a single output is created. A graph is made up of two perpendicular number lines, called the coordinate axes:
- The x‐axis is the horizontal number line whose values represent the equation’s inputs.
- The y‐axis is the vertical number line whose values represent the equation’s outputs.
- Any point plotted on a graph will be represented as (x, y) with the input first and the output second.
- The intersection of these two coordinate axes is called the origin, and its coordinates are always (0, 0).
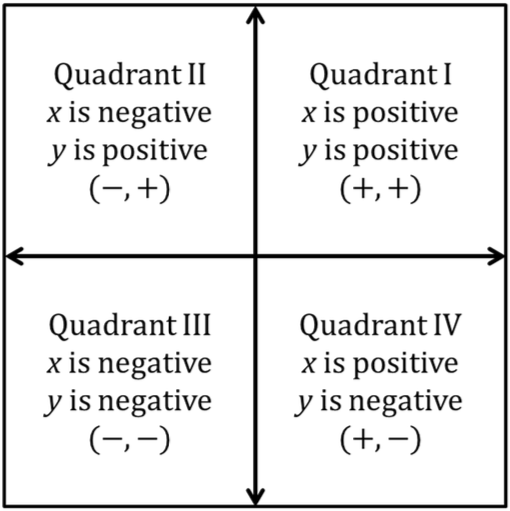
The coordinate axes break the graph into four sections, called quadrants. These quadrants help with the proper plotting of positive/negative inputs and positive/negative outputs:
Linear equations will generally come in two forms:
- standard
- slope‐intercept
You’ve already worked with the standard form in solving system of equations, though slope‐intercept is a variation of the standard form and pops up in the use of substitution. The main difference between the two is both variables are on the same side in standard form while the y is by itself in slope‐intercept form.


Though you need to know both forms, you’ll use the slope‐intercept form to answer questions about graphs. If a linear equation is in standard form and you are dealing with graphing concepts, change the equation to slope‐intercept form. In slope‐intercept form, a value is inputted into the linear equation, multiplied by the slope, and added to the y‐intercept. The result is the output. This process is true for all real numbers. Inputting 0 for x will always result in the y‐intercept for the equation and inputting 0 for the y will always result in the x‐intercept for the equation.
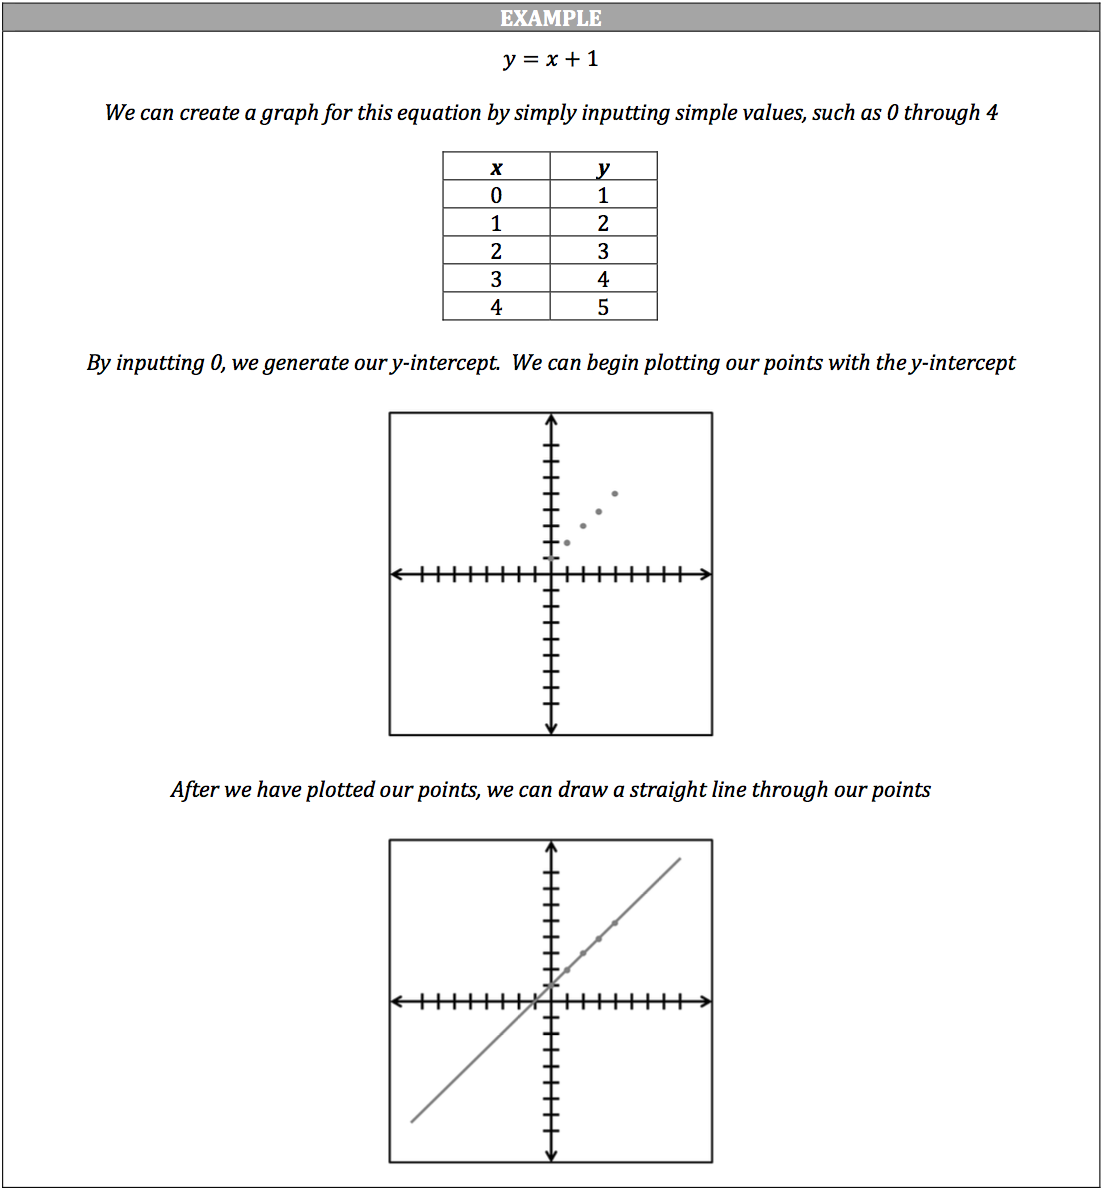
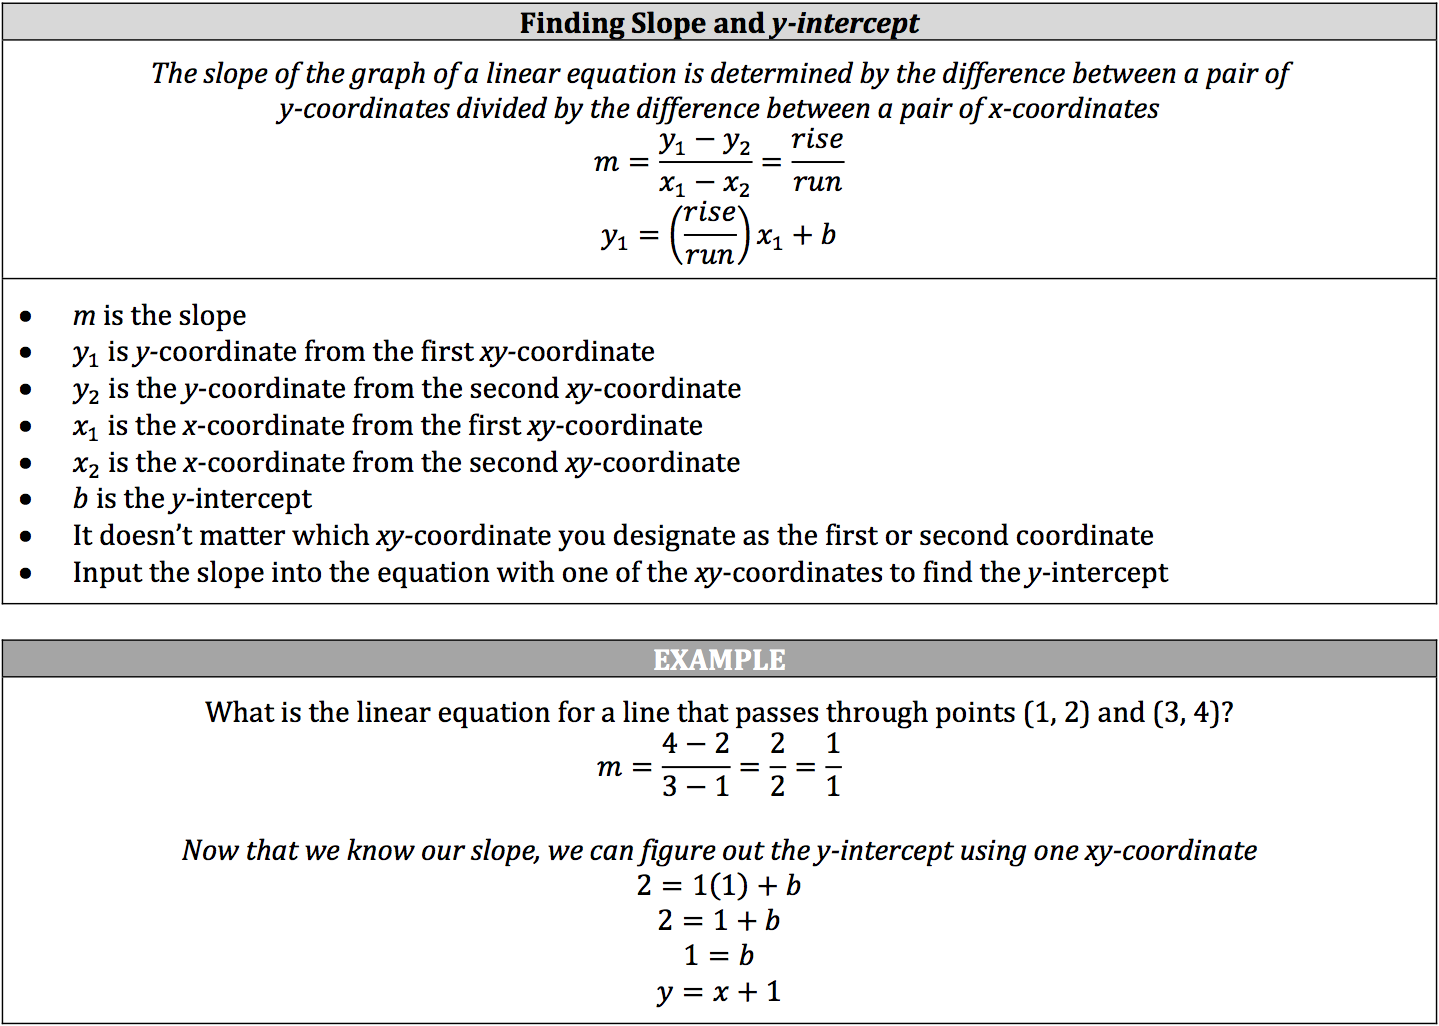
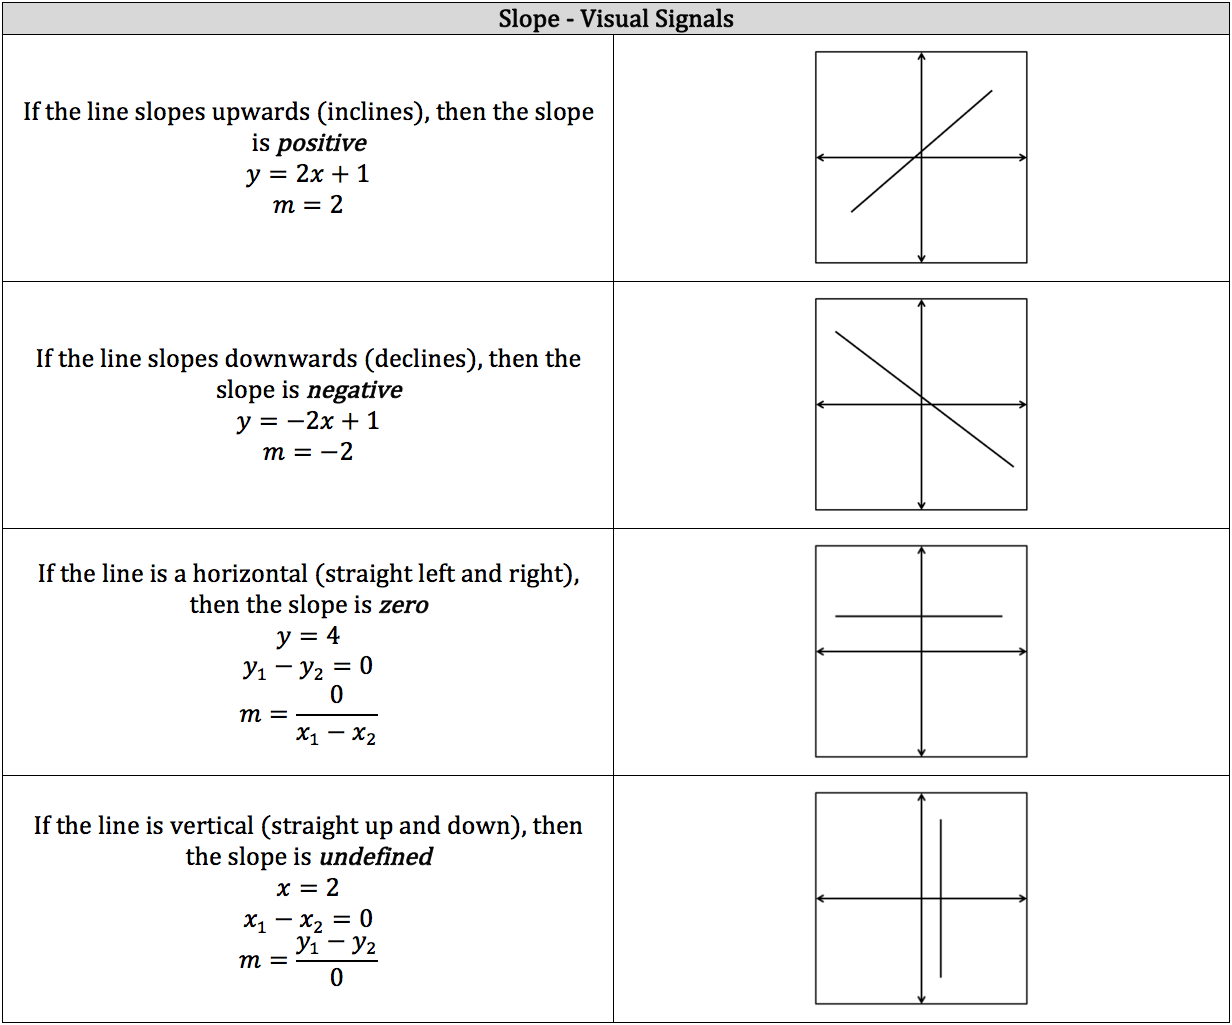
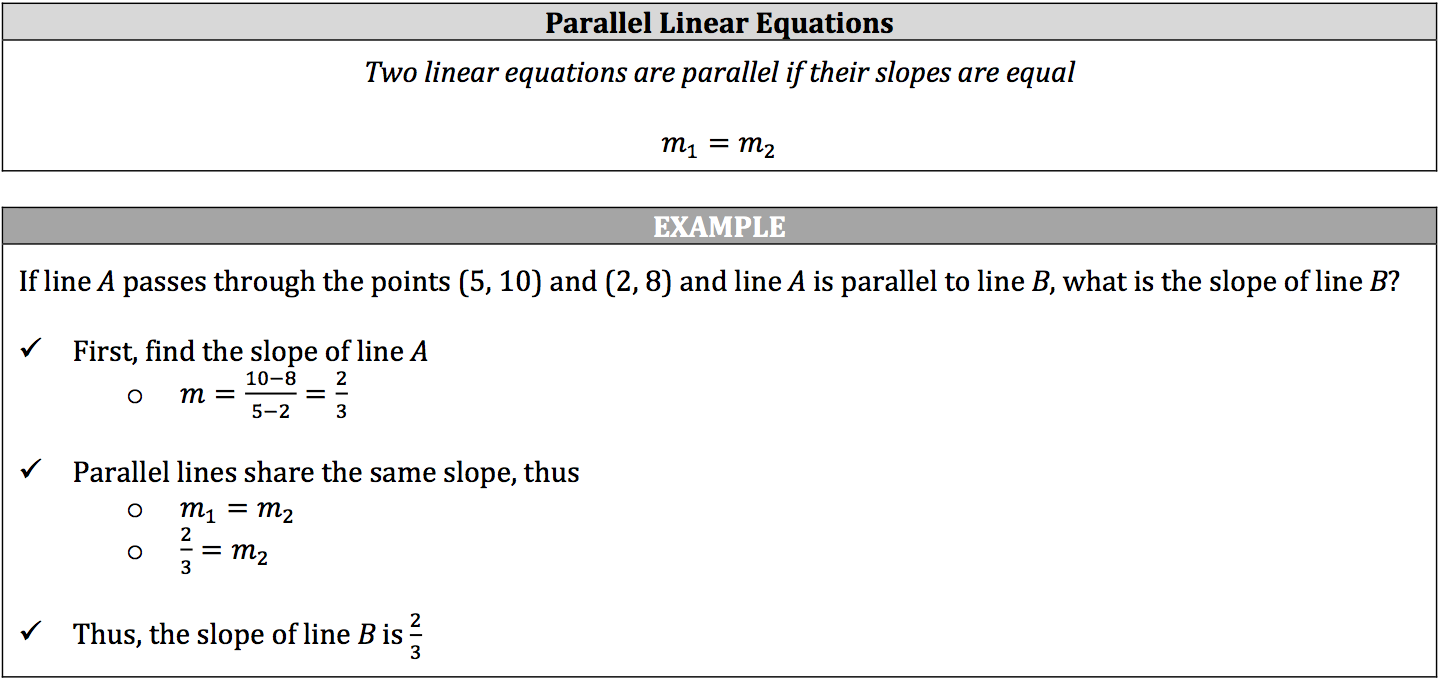
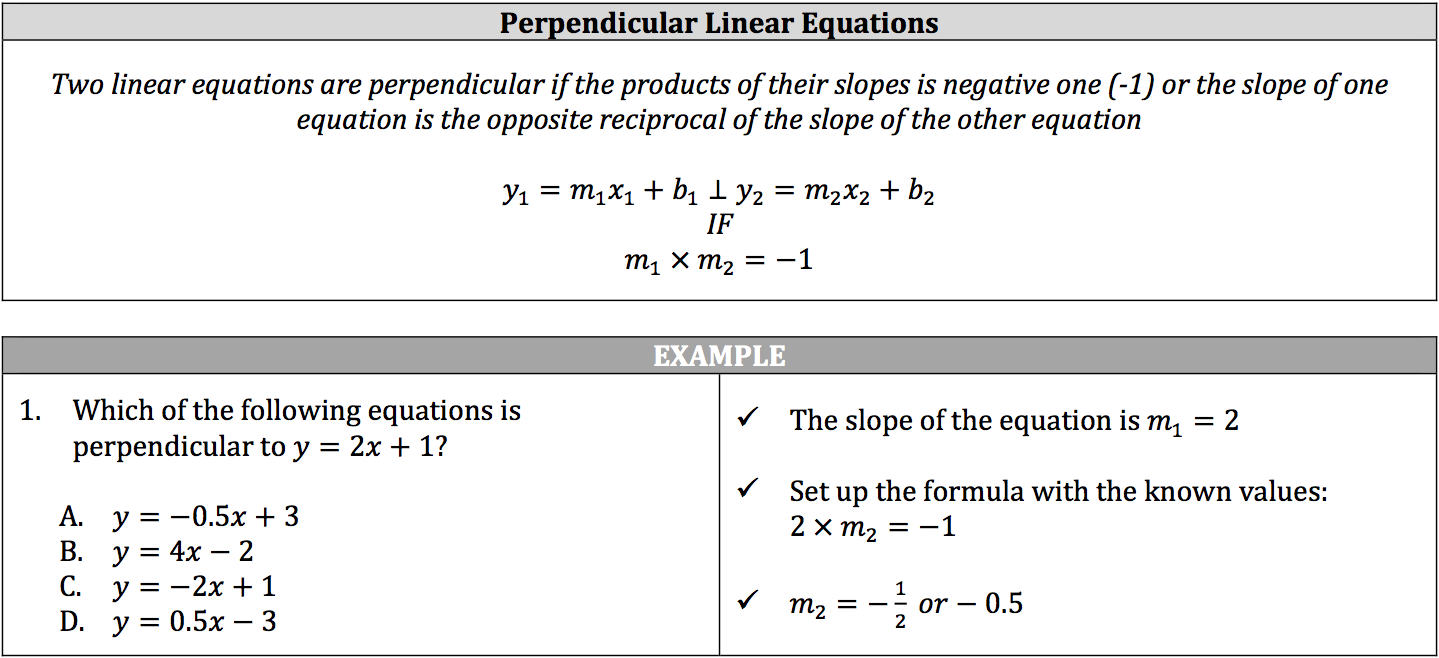
Since this is a multiple‐choice test, you will not be asked to physically graph any equations, but you are expected to know what a linear equation’s graph will look like. You may be given a complete linear equation that has a known slope and y‐intercept, or you may be given two xy‐coordinates. If you are only given coordinates, you will need to figure out what the linear equation is. You will need to figure out the linear equation’s slope and y‐intercept.


Leave A Comment