Below are answer explanations to the full-length Science test of the previously released ACT from the current 2020-2021 “Preparing for the ACT Test” (form 1874FPRE) free study guide available here from ACT for free.
The ACT Science test explained below begins on page 40 of the guide.
Please note that the 2020-2021 guide features the same practice test as the 2019-2020 guide. Other answer explanations in this series of articles:
- English Answer Explanations from 2020 ACT Practice Test
- Math Answer Explanations from 2020 ACT Practice Test
- Reading Answer Explanations from 2020 ACT Practice Test
- Science Answer Explanations from 2020 ACT Practice Test (this article)
- Writing Test Sample Essays from 2020 ACT Practice Test
When you’re finished reviewing this official practice ACT test, start practicing with our own 10 full-length practice ACT tests—absolutely free during the pandemic.
ACT Science Test Answer Explanations
Passage I
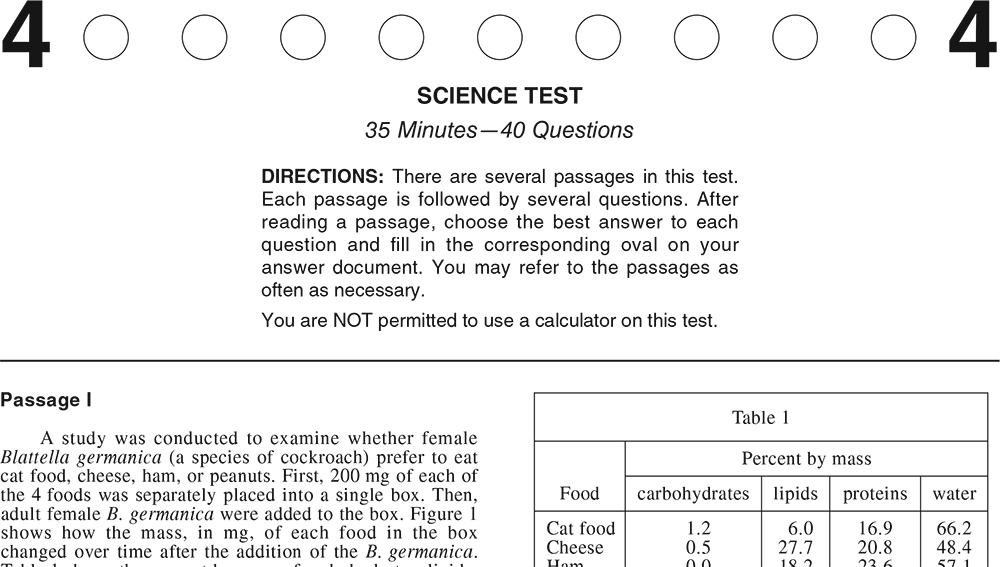
Question 1, “According to Figure 1…” The answer is “185 mg.”
This question tests your ability to interpret data.
- The question asks for the approximate mass of cheese remaining at 4 hours based on Figure 1. The graph in Figure 1 plots time (in hours) on the x-axis and mass of food remaining (in mg) on the y-axis.
- To determine how much cheese remains after 4 hours, we should look at the 4 hour mark. There are four columns which represent the 4 foods.
- Cheese is the blank/white column, so we isolate this one to see where it aligns on the “mass of food remaining” axis. The graph indicates that the mass of cheese remaining is more than 180 mgs but less than 190 mgs.
- Therefore, we can assume that the mass of cheese remaining at 4 hours is closest to 185 mg, which is the correct answer.
Question 2, “Suppose a company wants to use food…” The answer is “Peanuts.”
This question tests your ability to evaluate models and infer results.
- This question asks which food would maximize the capture of female B. germanica. The food that has the least mass remaining at the end of the study would maximize their capture. This is because the B. germanica would be baited most by the food that they preferred.
- Thus, we can solve this question by looking at Figure 1 to see which food has the least mass remaining at 28 hours.
- The shortest column has a diagonal line pattern, which corresponds to peanuts in the graph’s key. Therefore, the correct answer is peanuts.
Question 3, “Consider the 4 foods in order of the percent by mass of…” The answer is “decreased only.”
This question tests your ability to interpret data.
- The 4 foods in order of increasing protein percent by mass are cat food, cheese, ham, and peanuts (as seen in Table 1).
- To answer the question, we must look at Figure 1 to see the mass of each food remaining at 28 hours and how each value relates to the other.
- Cat food had the most mass remaining, followed by cheese, then ham, and finally peanuts. This means that the mass of food remaining at 28 hours decreased from cat food to cheese to ham to peanuts.
- This is the same order as the increasing order of foods by percent by mass of proteins. Therefore, we can say that for the 4 foods, as the percent by mass of proteins increased, the mass of food remaining at 28 hours only decreased.
Question 4, “Consider the statement ‘The B. germanica ate the food between…’” The answer is “4.”
This question tests your ability to evaluate models and infer results.
- This question asks how many foods are consistent with the statement “The B. germanica ate the food between 0 hr and 4 hr, between 4 hr and 16 hr, between 16 hr and 24 hr, and between 24 hr and 28 hr.”
- Basically, this statement means that the food was being eaten between each measurement in the graph at the different time stamps of 4 hours, 16 hours, 24 hours, and 28 hours.
- We know a food is being eaten if its mass remaining decreased. Therefore, we just need to see which columns get shorter for each time stamp on the graph.
- Looking at Figure 1, it is clear that all 4 foods decrease every time, even if it’s just by a little. Therefore, the statement is consistent with 4 of the foods, which is the correct answer.
Question 5, “A student predicted that the B. germanica would eat less cat food than ham…” The answer is “Yes, at 28 hr, the mass of cat food remaining was about 55 mg greater than the mass of ham remaining.”
This question tests your ability to evaluate models and infer results.
- This question asks whether the data in Figure 1 supports the prediction that less cat food would be eaten than ham at the end of the study. If less cat food were eaten than ham, then there would be more cat food mass remaining at 28 hours compared to the ham remaining mass.
- Looking at Figure 1, we can see that at 28 hours, the column for cat food is taller/higher than the column for ham. Therefore, there is more cat food remaining, meaning that less of the cat food was eaten.
- Thus, the answer is “yes,” the data in Figure 1 supports the student’s prediction. Next, we must determine the difference between the two remaining masses for cat food and ham.
- Ham is indicated by the grey bar while cat food is indicated by the black bar. The difference in height between these two bars can be easily counted. Each dashed line interval is equal to 10 mg.
- There are about 5.5 dashed line intervals between ham and cat food at 28 hours. This means that the mass of cat food remaining was about 55 mg greater than the mass of ham remaining.
- Therefore, the correct answer is “Yes, at 28 hr, the mass of cat food remaining was about 55 mg greater than the mass of ham remaining.”
Question 6, “Based on Table 1, when 200 mg of each of the 4 foods…” The answer is “Cat food and ham only.”
This question tests your ability to interpret data.
- This question asks which foods contained more than 100 mg of water. If each food was 200 mg, then the foods with more than 100 mg of water would contain at least 50% water by mass.
- We can answer this question by looking at Table 1 to see which foods have greater than 50% water by mass. Cat food has 66.2% and ham has 57.1%.
- Therefore, water accounts for more than 100 mg of the mass of cat food and ham only.
Passage II
Question 7, “Based on Student 1’s explanation, the same substance…” The answer is “Samples C and D.”
This question tests your ability to evaluate models and infer results.
- This question asks us to use Student 1’s explanation to figure out which two samples are composed of the same substance.
- Student 1’s explanation claims that in order for 2 samples to be composed of the same substance, all 5 properties must match. Thus, we can answer this question by looking at the table to see which samples have the same values for all 5 properties.
- Sample C has a mass of 6 g, a volume of 3 cm3, a density of 2 g/cm^3, a melting point of 237 ℃, and a boiling point of 885 ℃. Sample D has the same values for each property.
- The only samples that have the same values for all 5 properties are Samples C and D, which is the correct answer.
Question 8, “Based on Student 3’s explanation, the same substance…” The answer is “Samples G and H.”
This question tests your ability to evaluate models and infer results.
- This question asks us to use Student 3’s explanation to figure out which two samples are composed of the same substance.
- Student 3’s explanation claims that in order for 2 samples to be composed of the same substance, the values for mass, volume, and density must be the same. Thus, we can answer this question by looking at the table to see which samples have the same values for mass, volume, and density.
- Samples A and B have the same mass (8 g), volume (4 cm^3), and density (2 g/cm^3). Samples C and D have the same mass (6 g), volume (3 cm^3), and density (2 g/cm^3). Samples E and F have the same mass (8 g), volume (2 cm^3), and density (4 g/cm^3). Samples G and H have the same mass (4 g), volume (1 cm^3), and density (4 g/cm^3).
- Out of the possible answer choices, Samples G and H are the only ones that have the same mass, volume, and density. Therefore, according to Student 3’s explanation, the two samples that are composed of the same substance are Samples G and H.
Question 9, “Suppose that the temperature of Sample A is increased…” The answer is “Liquid, because the melting point of Sample A is 126 ℃.”
This question tests your knowledge of scientific investigation.
- This question asks whether Sample A would be a solid or a liquid at 250 ℃. We know that the melting point of a substance is the point at which it turns from a solid into a liquid.
- Therefore, if the melting point of Sample A is lower than 250 ℃, then Sample A will be a liquid at 250 ℃. This is because at 250 ℃, the temperature of Sample A has now exceeded the temperature at which Sample A turns from a solid to a liquid, so Sample A would be completely liquid.
- Looking at the table, the melting point of Sample A is 126 ℃, which is lower than 250 ℃. Therefore, the answer is “Liquid, because the melting point of Sample A is 126 ℃.”
Question 10, “Consider the claim that 2 samples having the same density…” The answer is “None of the students.”
This question tests your ability to evaluate models and infer results.
- This question asks which students would agree with the claim that 2 samples only need to have the same density to be composed of the same substance, regardless of the other 4 properties.
- Student 1 claims that all 5 values must match, which means that they definitely would not agree with the claim that the only value that must match is density.
- Student 2 claims that any 3 properties must match for samples to be composed of the same substance. Any samples that have the same values for less than 3 properties are not composed of the same substance, so Student 2 would not agree with the claim that only density must have the same value.
- Student 3 claims that the samples must have the same mass, volume, and density to be composed of the same substance. This means that if the mass or volume are different, the samples would be considered different substances. Thus, Student 3 would not agree with the claim that density is the only property that must match.
- Student 4 claims that samples must have the same density, melting point, and boiling point, and if any of the values for these 3 properties are different, then the samples are different substances. This means that Student 4 would not agree with the proposed claim that only density must match.
- Therefore, none of the students would agree with the claim.
Question 11, “Which of Students 2, 3, and 4 would…” The answer is “Students 2 and 3 only.”
This question tests your ability to evaluate models and infer results.
- This question asks which students (out of 2, 3, and 4) would agree that Samples A and B are composed of the same substance.
- Student 2 requires that the samples have the same values for any 3 properties in order to be composed of the same substance. The table indicates that Samples A and B have the same values for mass, volume, and density. Therefore, Student 2 would agree that Samples A and B are composed of the same substance.
- Student 3 believes that samples must have the same mass, volume, and density in order to be the same substance. As we mentioned before, Samples A and B have the same values for mass, volume, and density, so Student 3 would also agree that they are composed of the same substance.
- Student 4 claims that samples must have the same density, melting point, and boiling point in order to be the same substance. However, the melting points (126 ℃ vs 342 ℃) and boiling points (747 ℃ vs 959 ℃) of samples A and B are different. Therefore, Student 4 would not agree that Samples A and B are composed of the same substance.
- The correct answer is that only Students 2 and 3 would agree that Samples A and B are composed of the same substance.
Question 12, “Consider the statement ‘Two samples have the same…” The answer is “Student 2 only.”
This question tests your ability to evaluate models and infer results.
- This question asks which of Students 2 and 4 would agree that samples with the same mass, volume, density, and boiling point but different melting points are composed of the same substance.
- Student 2 only requires that at least 3 of the properties have the same values. Since these samples are claimed to have the same values for 4 properties, Student 2 would agree that the samples are composed of the same substance.
- Student 4 requires that the density, melting point, and boiling point of the samples be the same in order for them to be composed of the same substance. If any of these properties are different, then the samples are not the same substance.
- Since the samples have different melting points, Student 4 would not agree that the samples are composed of the same substance. Therefore the correct answer is “Student 2 only.”
Question 13, “Suppose that the temperature of Sample D is increased…” The answer is “Lower; Sample D will be a gas, and gases generally have lower densities than do solids.”
This question tests your ability to interpret data.
- At a sample’s boiling point, the sample turns from liquid to gas. If the temperature of Sample D is increased to 890 ℃, then this would be greater than the boiling point of Sample D, which is 885 ℃.
- This means that at 890 ℃, Sample D would be a gas. At 20 ℃, Sample D would be a solid. Gases are less dense than solids.
- Therefore, the answer is “Lower; Sample D will be a gas, and gases generally have lower densities than do solids.”
Passage III
Question 14, “Consider the volume of gas collected…” The answer is “0.30 g.”
This question tests your ability to interpret data.
- The volume of gas collected in Experiment 2 for Ni at 30 ℃ can be found by looking at Figure 2. At the 30℃ mark, the data point for Ni (indicated by a white square) corresponds to a volume of gas between 125 and 130 mL.
- We can now use this information to interpret Figure 1. The volume of gas collected (mL) for Ni (indicated by the white square line) is ~128 mL. This data point aligns with 0.30 g on the x-axis (mass in g) of Figure 1.
- Therefore, the volume of gas collected in Experiment 2 for Ni at 30 ℃ is the same amount of gas that was collected for 0.30 g of Ni.
Question 15, “How many temperatures were tested…” The answer is “1 temperature in Experiment 1 and 5 temperatures in Experiment 2.”
This question tests your knowledge of scientific investigation.
- In Experiment 1, each trial was tested at 30 ℃, so only 1 temperature was tested in Experiment 1.
- In Figure/Experiment 2, there are data points (black dot, white square, and white triangle) at 5 different temperatures (10, 20, 30, 40, and 50 ℃). This means that 5 different temperatures were tested in Experiment 2.
- Therefore, the correct answer is that 1 temperature was tested in Experiment 1 and 5 temperatures were tested in Experiment 2.
Question 16, “Which of the following statements describes a difference…” The answer is “multiple mass values of each metal were tested, but in Experiment 2, the same mass value of each metal was tested.”
This question tests your knowledge of scientific investigation.
- This question is asking what the difference is between Experiment 1 and Experiment 2. Looking at Figure 1, the graph plots mass (g) vs volume of gas collected (mL), while Figure 2 plots temperature (℃) vs volume of gas collected (mL).
- While both experiments are measuring the volume of gas collected, meaning that the dependent variable is the same, their independent variables differ.
- Experiment 1 changed the masses of each metal so that multiple mass values were tested. However, Experiment 2 only tested 1 mass of each metal (0.30 g) while changing the temperature of each metal.
- Therefore, the correct answer is that in Experiment 1, “multiple mass values of each metal were tested, but in Experiment 2, the same mass value of each metal was tested.”
Question 17, “Which of the following variables remained constant…” The answer is “Atmospheric pressure.”
This question tests your knowledge of scientific investigation.
- This question asks which variables remained constant throughout both experiments.
- We know that the mass of metal was changed in Experiment 1 while the temperature was changed in Experiment 2. This can be interpreted from Figures 1 and 2 respectively, because each of those variables was plotted on the x-axis, where the manipulated or independent variable is plotted.
- The volume of gas collected is a dependent variable. This was the variable that was being measured, meaning that it was not staying constant throughout either experiment because it changed depending on the mass of the metal or the temperature.
- The atmospheric pressure remained constant throughout both experiments, as stated in the last sentence before the figures were shown. The passage states “The atmospheric pressure was 758 mmHg throughout all 3 steps.”
- Therefore, the variable that remained constant throughout both experiments was atmospheric pressure.
Question 18, “If a temperature of 5℃ had been tested…” The answer is “Less than 107 mL, because for a given metal, the volume of collected gas decreased as the temperature decreased.”
This question tests your knowledge of scientific interpretation.
- This question can be answered by observing the general trend in Figure 2. As the temperature increases, the volume of gas collected increases for each metal. This means that as the temperature decreases, the volume of gas collected for each metal decreases.
- Therefore, if an even lower temperature of 5℃ had been tested, then the volume of gas collected for Zn would be less than 107 mL, the volume of gas that was collected for Zn at 10℃.
- Thus, the correct answer is “Less than 107 mL, because for a given metal, the volume of collected gas decreased as the temperature decreased.”
Question 19, “Consider the balanced chemical equation in…” The answer is “5.”
This question tests your ability to interpret data.
- The balanced chemical equation is M + 2HCl → MCl2 + H2.
- The mole ratio of HCl to H2 is 2:1. Therefore, if 10 moles of HCl are consumed, then we can divide this number by 2 to get the moles of H2 that are produced.
- 10 divided by 2 is 5. Therefore, 5 moles of H2 are produced.
Question 20, “Suppose that the trial in Experiment 1…” The answer is “2.”
This question tests your knowledge of scientific interpretation.
- Instead of using an inverted graduated cylinder, inverted 60 mL test tubes are being used to collect the gas.
- For 0.25 g of Zn, Figure 1 indicates that between 90 and 100 mL of gas will be collected. We can find the number of test tubes needed to collect this gas by dividing 95 by 60.
- This gives us ~1.5 test tubes, which must be rounded up to 2 test tubes. We cannot round down, because that leaves us with 1 test tube, which is not enough to collect all of the gas.
- Therefore, the correct answer is 2.
Passage IV
Question 21, “According to Figure 2, the maximum positive value of Vs…” The answer is “250 V.”
This question tests your ability to interpret data.
- In Figure 2, the circuit’s current, I, and the power supply voltage, Vs, are being measured across a 20 msec time interval. The voltage Vs is indicated by the dashed line.
- To find the maximum positive value of Vs, we must find the peak/crest of the dashed curve. On the graph, this highest point corresponds to either 0.25 amperes or 250 volts.
- Because we know that we are trying to find Vs, the power supply voltage, in volts, then we know that the maximum positive value of Vs is about 250 V.
Question 22, “A period is the time required for a wave to complete…” The answer is “20 msec.”
This question tests your ability to interpret data.
- Figure 3 plots the voltages across the components over a 20 msec time interval. VL is represented by the medium dashed line, while VR is represented by an interrupted line and VC is represented by a rapid/small dashed line.
- To find the period of VL, we must find the amount of time that it takes to go from its maximum point/crest to the next maximum point/crest, because this is the wave’s full cycle.
- The first maximum voltage of VL is found at about 0 msec, while the next maximum voltage of VL is found at 19-20 msec.
- The difference between these two times is ~19-20 msec, so the period for VL is 20 msec.
Question 23, “According to Figures 2 and 3, which voltage…” The answer is “VL.”
This question tests your ability to interpret data.
- This question asks which voltage varies the least. The amount that a voltage varies is also known as a wave’s amplitude, which is the difference between its maximum value and its minimum value.
- VS has its maximum point at 250 V and its minimum point at -250 V, meaning that it varies by 500 V.
- VR’s maximum voltage is found at 150 V and its minimum voltage is found at -150 V, meaning that it varies by 300 V.
- VL’s maximum voltage is found at 50 V and its minimum voltage is found at -50 V, meaning that it varies by 100 V.
- VC’s maximum voltage is 250 V and its minimum voltage is -250 V, meaning that it varies by 500 V.
- Based on these values, it is clear that the voltage that varies the least is VL.
- Note: this answer could also be answered by looking at the curves on the graphs. Since each graph has the same scale for voltage, the voltage that varies the least is simply the curve that is the shortest/shallowest.
Question 24, “Polarity refers to whether a voltage…” The answer is “VL and VC.”
This question tests your ability to interpret data.
- This question asks which 2 voltages are always opposite in polarity, meaning that when one voltage is positive, the other is negative.
- Looking at Figures 2 and 3, we can note that VS basically has the same curve as VC but is shifted to the left by 2 seconds. Thus, we can just focus on Figure 3 and imagine/draw the curve of Vs onto it.
- When VR is positive, all of the other voltages are also positive. Therefore, we can rule out any answer choice with VR in it.
- We are now left with either “VL and VC” or “VL and VS.” The maximum point of VC occurs at the same time as the minimum point of VL, and the minimum points of VC occur at the same times as the maximum points of VL.
- Additionally, VL and VC intersect zero at the same times. When VL is positive, VC is negative, and vice versa. This indicates that the voltages that are always in opposite polarity are VL and VC.
Question 25, “Based on Figure 2, at which of the following times…” The answer is “15 msec.”
This question tests your ability to interpret data.
- The passage states that the counterclockwise current flow is indicated by negative current values.
- Looking at Figure 2, the current is negative between 10 msec and 20 msec. At 10 msec and 20 msec, the current is zero. Before 10 msec, the current is positive.
- Based on this information, we can rule out any answer choice before 10 msec. This leaves us with the answer choices of “10 msec” or “15 msec.”
- At 10 msec, current is not negative because it is zero, which cannot be negative or positive. Therefore, we can rule out 10 msec.
- The correct answer is 15 msec, which lies in the middle of the interval from 10 msec to 20 msec for negative current.
Question 26, “The table below lists the electric charge…” The answer is “VC; over that time interval, both the charge and VC increased and then decreased.”
This question tests your ability to interpret data.
- From 7 msec to 13 msec, the charge increases from 0.51 uC to 0.87 uC and then decreases back to 0.51 uC.
- Looking at Figure 2 over the same interval, the current, I, started at its maximum point and then decreased without ever increasing again.
- Looking at Figure 3, the curve for VC starts at 150 V at time = 7msec, then increases to 250 V at time = 10 msec, and then decreases to 150 V at time = 13 msec.
- The charge on the capacitor changed more in sync with VC because both values increased and then decreased during the time interval of 7 msec to 13 msec.
Passage V
Question 27, “Based on the results of the study, which of the suspected mutagens…” The answer is “Substance N.”
This question tests your ability to interpret data.
- The passage states that bacteria must absorb histidine from their environment to continue growing because bacteria cannot synthesize histidine themselves. However, strains of bacteria can be mutated to restore their ability to synthesize histidine, which would allow their population to sustain an even greater level of growth.
- Based on this information, we can assume that the greatest number of His+ revertants corresponds to the dish that has the greatest number of colonies, because the dish was able to sustain much more growth than the other dishes.
- Dish 4 has the largest number of colonies and corresponds to Substance N. Therefore, Substance N resulted in the greatest number of His+ revertants.
Question 28, “Which dish in the study was intended to serve the purpose…” The answer is “Dish 1.”
This question tests your knowledge of scientific interpretation.
- This question asks which dish was supposed to test whether some of the bacteria could become His+ revertants without the addition of a mutagen. The dish that could test this would not contain histidine or mutagenic substances.
- The only dish that lacked histidine and suspected mutagens was Dish 1, which is the correct answer.
Question 29, “Based on the results of the study, what is the order of the suspected mutagens…” The answer is “P, L, M, N.”
This question tests your ability to interpret data.
- The substance with the least potential to be mutagenic is the dish that has the lowest number of colonies (excluding Dish 1, which did not contain a suspected mutagen). The dish with the smallest amount of colonies was Dish 5, which corresponds to Substance P.
- The substance with the most potential to be mutagenic is the dish with the greatest number of colonies. Dish 4 contains 107 colonies, which is much more than any of the other dishes. This corresponds to Substance N.
- Therefore, the order of suspected mutagens from least mutagenic potential to most mutagenic potential must start with Substance P and end with Substance N.
- The only answer choice that matches this criteria is “P, L, M, N,” which is the correct answer.
Question 30, “In the study, the scientists tested the effect of Substance P…” The answer is “As the concentration of Substance P increases, its potential to cause mutations increases only.”
This question tests your ability to evaluate data and infer results.
- A concentration of 100 x 10-9 g/mL is greater than a concentration of 50 x 10-9 g/mL, which is greater than a concentration of 10 x 10-9 g/mL.
- As concentration of Substance P increases, it is clear that the number of colonies also increases.
- Therefore, the correct answer is “as the concentration of Substance P increases, its potential to cause mutations increases only.”
Question 31, “Before bacteria were added to it, the dish…” The answer is “I and III only.”
This question tests your knowledge of scientific interpretation.
- The control dish was determined to be Dish 1. The passage states that Dish 1 contained a nutrient agar but lacked histidine. Dish 1 also lacked any of the 4 suspected mutagens.
- Therefore, the control dish lacked I, Histidine, and III, Suspected mutagen only.
Question 32, “Which of the following statements about the numbers of bacteria…” The answer is “Substance M was about 2 times the number of bacteria that became His+ revertants after exposure to Substance L.”
This question tests your ability to evaluate models and infer results.
- Comparing the results for Dishes 2 and 3, we see that Dish 3 resulted in 25 colonies, while Dish 2 resulted in 14 colonies. The number of colonies for Dish 3 was almost 2x that of Dish 2.
- Dish 3 corresponds to Substance M, and Dish 2 corresponds to Substance L.
- From this, we can infer that because the number of colonies for Substance M was 2 times the number of colonies for Substance L, the same can be said for the number of His+ revertants in each dish.
- Thus, the correct answer is “Substance M was about 2 times the number of bacteria that became His+ revertants after exposure to Substance L.”
Question 33, “The particular strain of S. typhimurium chosen for…” The answer is “wanted the bacteria in the study to be unable to repair the mutations caused by the substances.”
This question tests your knowledge of scientific interpretation.
- The bacteria were exposed to mutagens in hopes that their DNA would mutate so that they could have the ability to synthesis histidine. If the bacteria had DNA repair mechanisms, then these mechanisms would repair any mutations that were caused by the mutagens.
- This would nullify any effect that the mutagens might have, and it would prevent His+ revertants from existing and growing.
- Therefore, the scientists likely “wanted the bacteria in the study to be unable to repair the mutations caused by the substance.”
- The answer choices “did not want the bacteria in the study to synthesis any DNA” and “did not want the bacteria in the study to synthesize any proteins” are incorrect because the bacteria will synthesize both DNA and proteins regardless of the presence or absence of repair mechanisms.
Passage VI
Question 34, “The researchers conducting the studies chose to use…” The answer is “nonporous and impermeable, and therefore incapable of absorbing water.”
This question tests your knowledge of scientific interpretation.
- Plastic material is not permeable to water, which is why plastic water bottles can contain water. If a substance is not permeable, liquids or gases cannot pass through it.
- On the other hand, wood is both porous and permeable to water. This means that wood is a material that can absorb water, while plastic cannot.
- Thus, the correct answer is “nonporous and impermeable, and therefore incapable of absorbing water.”
Question 35, “Suppose Study 2 had been repeated, except in a lab kept…” The answer is “near or at zero, because -1℃ is below the freezing point of water.”
This question tests your knowledge of scientific interpretation.
- The freezing point of water is 0℃. If the lab had been kept at -1℃, which is lower than the freezing point of water, then the runoff collected in the plastic box would have frozen before it fell into the trough to be measured.
- This means that the volume of runoff that was measured would probably have been near zero, because it would all turn to ice before being able to flow into the trough to be measured.
- Thus, the correct answer is “near or at zero, because -1℃ is below the freezing point of water.
Question 36, “According to the results of Study 1, for which of the wind speeds…” The answer is “1.0 m/sec and 2.5 m/sec only.”
This question tests your ability to interpret data.
- Figure 1 depicts the results of Study 1 in a graph that plots the volume of runoff per 20 min over time for different wind speeds.
- There are two curves on the graph that reach a volume of zero before time = 500 min. These are the diamond curve and the circle curve, which correspond to the 2.5 m/sec and 1.0 m/sec wind speeds respectively.
- Thus, the two wind speeds for which the runoff volume per 20 min decreased to zero before 500 min were 1.0 m/sec and 2.5 m/sec only.
Question 37, “Compare the results of the 2 trials in Study 2…” The answer is “without sand layer for greater maximum and without sand layer for shorter time to zero.”
This question tests your ability to interpret data.
- In Figure 2, the curve that reaches the highest point on the y-axis is the curve with white circles. This corresponds to the “without sand layer” curve, which has the greater maximum value for runoff volume in Study 2.
- Additionally, the curve that reaches zero in the shortest time has white circles and corresponds to “without sand layer.”
- Thus, “without sand layer” obtained both the greater maximum value and the fastest decrease to zero.
Question 38, “The volume of runoff measured at 200 min in Study 1…” The answer is “Choice J .”
This question tests your ability to interpret data.
- At 200 min in Figure 1, the star curve and circle curve intersect at the same point, meaning that they should have the same value/height in the bar graph. These curves correspond to wind speeds of 0.5 m/sec and 1.0 m/sec respectively.
- Additionally, the star curve and the circle curve correspond to the highest value of runoff volume out of the 4 wind speeds, so these should be the two tallest columns in the bar graph.
- Thus, we can rule out choices F and G, since these graphs do not contain the same values for 0.5 m/sec and 1.0 m/sec.
- Next, at 200 min, you can see that the lowest value of runoff volume corresponds to the diamond curve, aka 2.5 m/sec wind speed. Thus, on the bar graph, the column for 2.5 m/sec should be the shortest.
- Choice J is the only graph that corresponds to all of these criteria.
Question 39, “Which factor was varied in Study 1 but kept the same in Study 2?” The answer is “Wind speed.”
This question tests your knowledge of scientific interpretation.
- In Study 1, there were 4 trials where the wind speeds were varied.
- Meanwhile, in Study 2, the second trial of Study 1 was repeated twice. This means that the wind speed stayed the same for Study 2, because the wind speed of 1.0 m/sec for the second trial was repeated twice.
- Thus, the factor that was varied in Study 1 but kept the same in Study 2 was wind speed.
Question 40, “Based on the diagram and the description of Study 1, which of the following…” The answer is “30 cm x 60 cm x 120 cm.”
This question tests your ability to interpret data.
- The volume of a box is calculated by multiplying the length, width, and height of the box together. (V = lwh)
- The height of the sand layer is 30 cm, its length is 120 cm, and its width is 60 cm. Thus, the volume of the sand layer can be found by multiplying 30 cm by 60 cm by 120 cm.
- The correct answer is “30 cm x 60 cm x 120 cm.”
