Although a majority of Wisconsin’s 2019 high school graduates plan to attend college—and many hope to stay close to home—they are, on average, performing at the lowest rates in recent years. This is a key takeaway from an analysis of Wisconsin students’ 2019 ACT Scores.
In the 2019 graduating class, 66,729 Wisconsin students took the ACT; their mean composite score was a 20.3 out of a possible 36. For comparison, 2018’s graduating class had about 1,200 more students and scored slightly higher, with a mean composite of 20.5. Nationally, the average composite score was a 20.7 (down from 2018’s mean composite of 20.8).
(Top image caption – Waukesha Engineering Preparatory Academy had the highest average 2019 ACT scores.)
Since 2016, the ACT is compulsory for all Wisconsin high school juniors; this requirement means that Wisconsin’s data is remarkably complete. In 2019, it was one of 15 states where an estimated 100% of graduates took the ACT. Among these, it tied with Utah for the highest average composite score. (Nevada ranked lowest with an average of 17.9.)
Wisconsin’s high ranking among states with 100% participation is particularly impressive, since states with higher testing levels tend to have lower average scores. (They include results from students whose future plans may not include college-level coursework, for instance.)
In states where standardized testing like the ACT is optional, most test-takers are self-selecting and academically advanced, which is reflected in their test scores. For example, consider Connecticut and Massachusetts, which had the highest average ACT scores in the nation (both 25.5), but only tested 22% and 21% of graduates, respectively.
ACT College Readiness Benchmarks
The ACT’s “College Readiness Benchmarks” are the scores (out of 36) on the subject area tests that indicate a student’s chances of college success. The ACT believes that meeting the benchmarks for English, Reading, Mathematics, and Science gives a student a 50% chance of earning a B or higher or a 75% chance of getting a C or higher in a corresponding freshman-level college course. Unchanged since 2013, these benchmark scores and their college course equivalents are:
- English (English Composition) – 18
- Reading (Social Sciences) – 22
- Math (College Algebra) – 22
- Science (Biology) – 23
Since 2015, the ACT has also offered a College Readiness Benchmark for coursework in STEM (science, technology, engineering, and math), based on scores on the Math & Science subject area tests. Because college-level STEM coursework tends to be more academically challenging (for instance, many STEM freshmen begin with Calculus instead of Algebra), ACT has determined that the benchmark ACT score is significantly higher for STEM than in other subject areas. Meeting the STEM benchmark indicates a 50% chance of earning a B or higher in identified college-level STEM courses. The benchmark score is:
- Math & Science (STEM) – 26
Average ACT Score in Wisconsin – Fewer Wisconsin Juniors are College-Ready
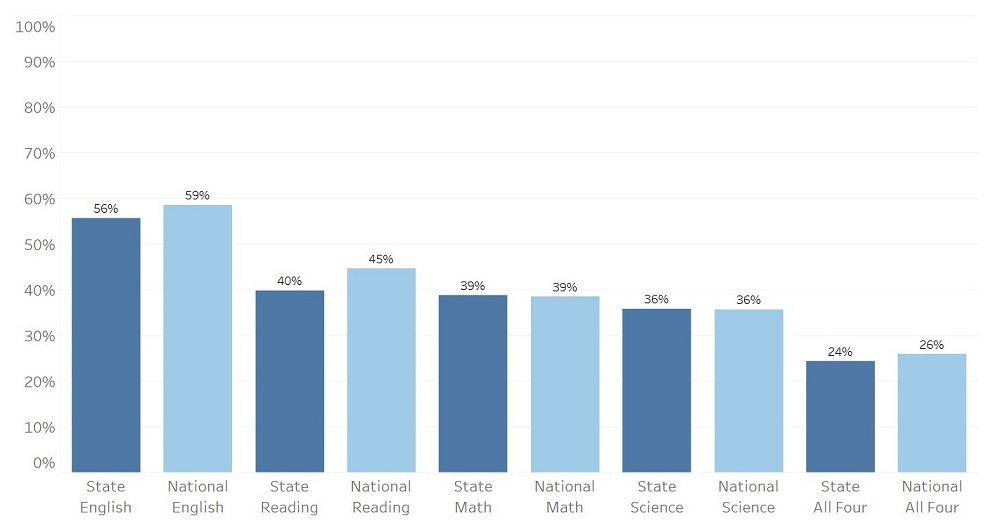
Percent of Wisconsin Students (dark blue) Compared to the Nation (light blue) Meeting College Benchmarks (ACT Inc.)
With an average ACT composite score of 20.3, Wisconsin’s Class of 2019 slightly trails the national average for students meeting ACT College Readiness Benchmarks (CRBs) in two subject areas. A slim majority of Wisconsin students (56%) are prepared for college English, the only subject area in which more than half of students met the benchmark score. Only 40% met the Reading benchmark. Although a minority of graduates are college-ready in Math (39%) and Science (36%), these numbers are on par with national averages.
Concerningly, when compared to the class of 2018, this set of graduates showed less college preparedness in all areas except Science. The biggest drop was in English, where 3% fewer students met the benchmark score, and the average score dropped by 0.4 points. The average scores of 2019 students also decreased by 0.2 points in Reading and by 0.1 points in Math.
Most worrying, 2019 marked the first time that the number of Wisconsin students meeting none of the benchmarks exceeded the number of those who are meeting 3 or more, as show in the chart below.
Wisconsin ACT Scores Show a Racial Achievement Gap
Sadly, one of the biggest indicators of ACT success is one over which students have no control: their racial background. Nationally, Asian Americans have the highest rates of success, followed by white students. Students who identify as Black or African American score the lowest, just behind students with American Indian heritage. (Students who identify as either Hispanic or Pacific Islander score somewhere in the middle.)
Wisconsin’s 2019 results mirror these nationwide trends. While 43% of white students met three or more College Readiness Benchmarks, only 6% of Black students and 17% of Latino graduates did so. The performance of Wisconsin’s Black students is particularly concerning; they are meeting CRBs at half of the national average.
Although the achievement gap between Black and white students has narrowed for the past two years, this is largely due to white students performing more poorly on the ACT, rather than a marked improvement in Black students’ scores.
It’s important to note that this disparity in scores is not unique to the ACT. A recent report from the National Assessment of Educational Progress (NAEP) studied 4th- and 8th-grade students indicated that Wisconsin has the widest educational achievement gap in the nation. Disparities in ACT scores likely have their roots in disparate early childhood educational experiences.
How to Improve ACT Scores
Luckily for students looking to increase their chances of ACT success, there are several actions they can take which are statistically likely to improve their scores.
- Focus on schoolwork and take academically challenging classes. Students who do better in school nearly always do better overall on standardized tests like the ACT. Students hoping to improve their chances on the ACT should aim to take “core curriculum” courses (four years of English and three years of math, social studies and science).
- Take the ACT more than once. There is a clear statistical advantage to retesting; in 2019, the average composite score of Wisconsin students who took the ACT two or more times was 23.2, over 4 points higher than the average composite score (18.9) of those who took the test only once. Students worried about the cost of retesting should consider ACT’s fee waiver program, which allows eligible students to test for free.
- Spend time studying and preparing specifically for the ACT. Taking practice tests helps students familiarize themselves with the content and the format of the test and gives them specific feedback. In addition, working with a tutor can be an effective way of improving a student’s weakest areas and developing test-taking strategies. Piqosity offers a full suite of free ACT Practice materials and analyses of previously-released ACT tests, perfect for students looking to increase their chances of ACT success.
Most Popular Wisconsin Colleges for ACT Examinees
About two-thirds of Wisconsin’s Class of 2019 aspire to postsecondary education, with half of those aiming for a four-year bachelor’s degree. Good news for parents worried about becoming empty-nesters: a majority of these college-bound students want to remain within the borders of the Badger State! A clear majority (60%) of Wisconsin students’ ACT score reports were sent to public in-state colleges.
The top five colleges among test-takers were:
- University of Wisconsin – Madison
- University of Wisconsin – Milwaukee
- University of Wisconsin – La Crosse
- University of Wisconsin – Oshkosh
- University of Wisconsin – Whitewater
Admission to some of these schools is fairly competitive—at Madison (although submitting ACT scores is optional) an ACT score of 27 or above is recommended for applicants. At Oshkosh, the recommendation is more easily attainable: an ACT score of 22.7 or higher. (In 2019, a majority of students at 22 high schools achieved this score.)
These colleges are also within the financial reach of many: all five rank within the Top 15 Most Affordable Colleges in Wisconsin, with yearly in-state tuition below $10,000.
Best High Schools in Wisconsin by ACT Scores
The table below presents 2019 ACT Scores from 500 Wisconsin high schools for which full data was available. Explore the original data from the Wisconsin Department of Public Instruction here.
Top 10 Wisconsin High Schools by 2019 Average ACT Scores (composite)
- Waukesha Engineering Preparatory Academy (25.8)
- Kohler High (25.2)
- Tesla Engineering Charter School (24.9)
- Lakeview Technology Academy (24.7)
- Whitefish Bay High (24.6)
- Kettle Moraine Global School for Global Leadership and Innovation (24.2)
- Homestead High (24.1)
- Middleton High (24.0)
- Cedarburg High (23.9)
- Central High – Elmbrook (23.9)
How to Read This Sortable Table
- The default sort is by composite score from highest to lowest; to change the sorting order, click on the header by which you want to sort
- “Avg Score” is the composite ACT score from 0 to 36
- “English, Reading, Math, Science” refers to the school’s average scores in each subject test from 0 to 36
- “# Tested” is the number of students who sat for the exam at each school
Wisconsin ACT Scores 2019
| wdt_ID | School | Avg Score | English | Reading | Math | Science | # Tested |
|---|---|---|---|---|---|---|---|
| 1 | Waukesha Engineering Preparatory Academy | 25.80 | 24.80 | 26.70 | 25.40 | 25.70 | 43 |
| 2 | Kohler High | 25.20 | 24.70 | 25.70 | 24.70 | 25.40 | 60 |
| 3 | Tesla Engineering Charter School | 24.90 | 22.70 | 25.50 | 26.00 | 25.10 | 30 |
| 4 | Lakeview Technology Academy | 24.70 | 23.50 | 25.60 | 24.50 | 24.60 | 102 |
| 5 | Whitefish Bay High | 24.60 | 23.90 | 25.60 | 24.10 | 24.40 | 214 |
| 6 | Kettle Moraine Global School for Global Leadership and Innovation | 24.20 | 24.30 | 25.20 | 22.70 | 24.30 | 22 |
| 7 | Homestead High | 24.10 | 24.00 | 24.90 | 23.00 | 23.80 | 334 |
| 8 | Middleton High | 24.00 | 23.30 | 24.90 | 23.30 | 23.90 | 490 |
| 9 | Cedarburg High | 23.90 | 23.90 | 24.30 | 23.00 | 23.80 | 280 |
| 10 | Central High - Elmbrook | 23.90 | 23.50 | 24.20 | 24.00 | 23.70 | 317 |
| 11 | Eisenhower Middle/High | 23.80 | 23.30 | 24.00 | 24.00 | 23.60 | 201 |
| 12 | East High - Elmbrook | 23.70 | 22.30 | 24.10 | 23.90 | 24.10 | 295 |
| 13 | Shorewood High | 23.60 | 22.80 | 24.40 | 23.30 | 23.60 | 148 |
| 14 | Oostburg High | 23.60 | 24.30 | 22.80 | 22.40 | 24.20 | 71 |
| 15 | High School of Health Sciences | 23.50 | 22.90 | 24.30 | 22.70 | 23.30 | 44 |
| 16 | Platteville High | 23.20 | 23.00 | 23.40 | 22.80 | 23.10 | 101 |
| 17 | Arrowhead High | 23.20 | 21.70 | 23.30 | 23.50 | 23.60 | 541 |
| 18 | Pewaukee High | 23.00 | 22.50 | 23.50 | 22.30 | 23.20 | 227 |
| 19 | Waunakee High | 23.00 | 21.50 | 23.10 | 23.30 | 23.60 | 310 |
| 20 | West High - Madison | 23.00 | 22.50 | 24.20 | 22.00 | 22.80 | 509 |
| 21 | Green Lake High | 22.90 | 23.30 | 23.80 | 21.10 | 23.30 | 16 |
| 22 | Grafton High | 22.80 | 22.00 | 23.30 | 22.40 | 22.80 | 168 |
| 23 | West De Pere High | 22.40 | 21.40 | 22.50 | 22.40 | 22.90 | 228 |
| 24 | Sevastopol High | 22.40 | 22.20 | 22.80 | 22.00 | 22.00 | 45 |
| 25 | Hamilton High - Hamilton | 22.40 | 21.30 | 23.00 | 22.20 | 22.60 | 328 |
| School | Avg Score | English | Reading | Math | Science | # Tested |
Get Prepared for the ACT with Piqosity
- Download free official ACT practice tests and review our answers explanations
- Register for a free Piqosity account to access our 10 full-length ACT practice tests
For the full datasets referenced in this article:
- The Condition of College and Career Readiness 2019: Wisconsin Key Findings, ACT, Inc.
- The Condition of College and Career Readiness 2019, ACT, Inc.
- Wisconsin Certified ACT Results 2018-2019, Wisconsin Department of Public Instruction
