
If you’re looking to attend one of the top Kentucky high schools, make sure you check out those associated with a university: the top two high schools with the highest average ACT scores were both magnet high schools affiliated with an institution of higher learning. Although it’s only one metric, a school’s average ACT scores can reveal a lot—they are usually a reliable indicator of college- and career-readiness, and the “best” high schools are those which adequately prepare their students for college or a career. This article looks at general trends in Kentucky’s 2020 ACT scores with a focus on the top-scoring high schools across the state.
Kentucky’s Class of 2020 included 50,938 students who took the ACT; they scored a mean composite of 19.5 out of a possible 36. For reference, 2019’s graduating class had about 400 more students and scored somewhat higher, with a mean composite of 19.8. Nationally, the average composite score in 2020 was 20.6 (down slightly from 2019’s mean composite of 20.7).
(Top image caption—the prestigious Gatton Academy of Mathematics and Science has Kentucky’s highest average ACT scores)
For over 10 years, Kentucky has administered the ACT to all high school juniors. Consequently, the state’s data is remarkably complete. In 2020, it was one of 15 states where an estimated 100% of graduates took the ACT; among these, it scored higher than eight other states. Of the states with 100% participation, Utah had the highest average score (20.2), and Nevada had the lowest (17.9).
Kentucky Scores in Context
To more fully contextualize this, it’s important to point out that states with higher testing levels tend to have lower average scores. One main reason for this is that they include results from students whose future plans may not include college-level coursework (in some cases, these students will “take” the test but not actually complete it, resulting in artificially low scores). In states where standardized testing like the ACT is optional, test-takers are primarily a self-selecting, academically advanced cohort, which is reflected in their test scores.
Consider, for example, Massachusetts, which had 2020’s highest average ACT scores in the nation (26.0), but administered tests to only 18% of graduates (just over 13,000 students). As the figure below shows, a comparison of the two states’ score distributions reveals that Massachusetts scores are skewed heavily towards the higher end; there is not a gradual “drop-off” of students as the average score increases (which we would expect in a more “normal” distribution).
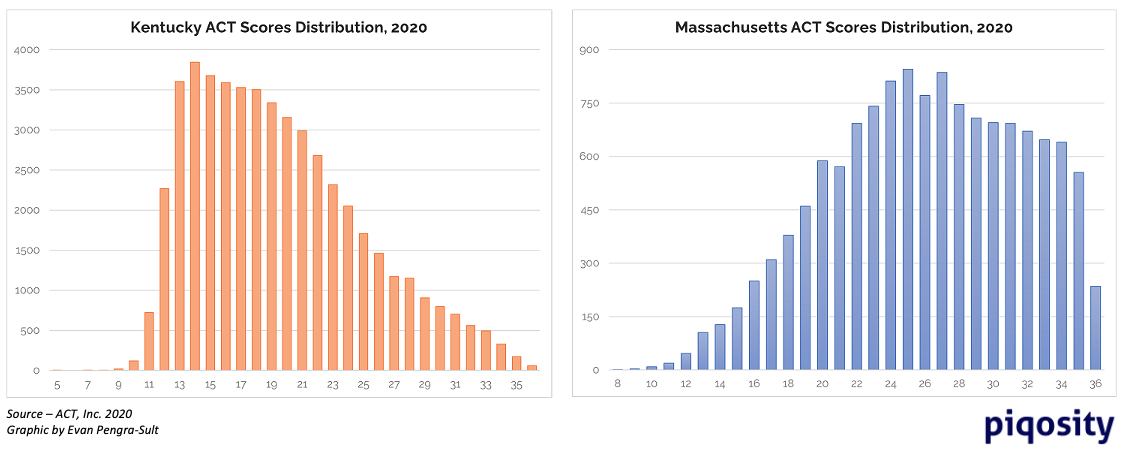
Let’s look at another metric: nearly half of Massachusetts test-takers scored a mean composite of 25.0 or higher, but only 15% of Kentucky graduates met this benchmark. At first glance, it might appear that Massachusetts is simply better at producing high-achieving graduates. But this fails to take into account the significant difference in the size of the testing pools—a closer examination reveals that Kentucky actually had nearly 1,500 more graduates with scores above 25.0 than Massachusetts did.
In other words, while the average Kentucky student may achieve a lower ACT score than many of their peers across the country, Kentucky’s academically gifted students more than hold their own.
It can also sometimes be useful to look at how a state compares to others in the same geographical region. For Kentucky, this may not be as informative a metric; only two of its bordering states (Tennessee and Ohio) test a comparable percentage of students. (Of these, Kentucky’s results outpace Tennessee’s and slightly trail Ohio’s.)
ACT College Readiness Benchmarks
The ACT’s “College Readiness Benchmarks” are the scores (out of 36) on the subject area tests that indicate a student’s chances of college success. The ACT believes that meeting the benchmarks for English, Reading, Mathematics, and Science gives a student a 50% chance of earning a B or higher or a 75% chance of getting a C or higher in a corresponding freshman-level college course. Unchanged since 2013, these benchmark scores and their college course equivalents are:
- English (English Composition) – 18
- Reading (Social Sciences) – 22
- Math (College Algebra) – 22
- Science (Biology) – 23
Since 2015, the ACT has also offered a College Readiness Benchmark for coursework in STEM (science, technology, engineering, and math), based on scores on the Math & Science subject area tests. Because college-level STEM coursework tends to be more academically challenging (for instance, many STEM freshmen begin with Calculus instead of Algebra), ACT has determined that the benchmark ACT score is significantly higher for STEM than in other subject areas. Meeting the STEM benchmark indicates a 50% chance of earning a B or higher in identified college-level STEM courses. The benchmark score is:
- Math & Science (STEM) – 26
Many Kentucky Juniors are Not College-Ready
Kentucky’s Class of 2020 lags behind the national average for students meeting ACT College Readiness Benchmarks (CRBs). Kentucky graduates are most college-ready in English, with just over half (53%) of graduates meeting the CRB. But the numbers are lower in other subject areas, with 38% meeting the Reading benchmark, and just under one-third showing college readiness in Math (28%) and Science (29%).
Broadly speaking, 2020’s results continue a recent trend of gradually decreasing college-readiness among Kentucky students. Dishearteningly, the number of students who failed to meet CRBs in all subject areas has risen nearly 10% in the past two years. Although this reflects poorer performance across the board, the most precipitous drop (over 6%) has been in English, as shown in the chart below.
Kentucky’s Racial & Economic Achievement Gaps
Nationally, there is a concerning correlation between a student’s racial background and their likelihood of. In general, Asian Americans have the highest rates of success, followed by white students. Students who identify as Black or African American score the lowest (Hispanic students, and students of other races, generally score somewhere in the middle.) It is important to emphasize that this is not a causative relationship. Black students do not score worse than white students, on average, because they are Black; rather, it is that many factors which negatively impact ACT scores tend to disproportionately affect non-white (and non-Asian) students.
Kentucky’s 2020 results reveal a similar racial achievement gap, but one which is somewhat smaller than the national trend. Nationwide, the gap between the composite ACT scores of the highest- and lowest-scoring groups of students is over 8.2 points; in Kentucky it is 6 points. Still, the gap is real: while 49% of Kentucky’s Asian students and 34% of white students met three or more College Readiness Benchmarks, only 9% of Black graduates and 18% of Latinos did so.
Closing this achievement gap will take hard work, but it’s not an insurmountable challenge, in part because white students make up a substantial majority (69%) of Kentucky’s graduating class. (The next largest group, Black students, makes up 8%, Latinos comprise 6%, and the mostly high-achieving Asian students make up less than 2% of graduates). To put it in terms of concrete numbers, if Kentucky wanted to achieve parity in college readiness between white and Black students, they would only need to improve the scores of just over 1,000 Black students.
In addition to race, a student’s economic status is often closely related to their ACT performance. Nationwide, the achievement gap between students whose family income is less than $36,000 a year (classified as “low income”) and those whose family income exceeds that amount is very wide: when comparing students who meet 3 or more CRBs, over 20 percentage points separate the two groups. In Kentucky this gap is smaller—around 15 percentage points—but still shows room for improvement.
How to Improve ACT Scores
Luckily for students of all racial and economic backgrounds looking to increase their chances of ACT success, there are several actions they can take which are statistically likely to improve their scores.
- Focus on schoolwork and take academically challenging classes. Students who do better in school nearly always do better overall on standardized tests like the ACT. For instance, 2020 Kentucky seniors who took Biology, Chemistry, and Physics were more than three times more likely to meet the Science CRB than those who had taken fewer than three years of natural science classes.
- Take the ACT more than once. There is a clear statistical advantage to retesting; in 2020, Kentucky students who took the ACT two or more times had an average composite score 5.6 points higher than those who took the test only once. Students worried about the cost of retesting should consider ACT’s fee waiver program, which allows eligible students to test for free.
- Spend time studying and preparing specifically for the ACT. Taking practice tests helps students familiarize themselves with the content and the format of the test and gives them specific feedback. In addition, working with a tutor can be an effective way of improving a student’s weakest areas and developing test-taking strategies. Piqosity offers a full suite of free ACT Practice materials and analyses of previously-released ACT tests, perfect for students wondering how to improve their ACT scores.
Kentucky’s Colleges are Popular and Affordable
A majority (57%) of 2020 Kentucky graduates aspire to a minimum of a four-year bachelor’s degree. (Note: about 31% of Kentucky’s 2020 Senior Class did not indicate their post-secondary educational plans.) If these college-bound students are anything like their peers in previous years, a majority likely want to remain within the borders of the Bluegrass State. Seniors in 2019, for instance, sent about 62% of their ACT score reports to public in-state colleges; their top five selections were:
- University of Kentucky
- University of Louisville
- Western Kentucky University
- Eastern Kentucky University
- Morehead State University
While high ACT scores make any student an attractive candidate, all of these five except the University of Louisville will consider students for admission without test scores. (Some require ACT scores if students wish to be considered for academic scholarships.)
At the University of Louisville, each department has a different ACT benchmark for admissions: for instance, students applying to the College of Arts & Sciences should have earned:
- a GPA of 2.5 and
- an ACT Composite Score of 20
(For reference, in 2019 a majority of students at 46 Kentucky high schools met or exceeded this ACT score.)
Students hoping to enter the School of Business at Louisville have a higher bar to clear:
- a GPA of 3.0
- an ACT Composite Score of 25 and
- an ACT Math Score of 23
(This is a much higher standard; it is estimated that less than 15% of 2020 graduates met or exceeded these ACT scores.)
Regardless of where students end up, Kentucky colleges are well within the financial reach of many students—for instance, all of the five schools listed above rank within the Top 11 Most Affordable Colleges at which to obtain a bachelor’s degree.
Best High Schools in Kentucky by ACT Scores
Due to the impact of COVID-19, the 2019-2020 Kentucky School Report Cards were released without the inclusion of 11th grade ACT scores. Consequently, the following table uses data from 2019 (the last year for which complete information was available) from 273 Kentucky high schools.
Top 10 Kentucky High Schools by 2019 Average ACT Scores (composite)
Two schools each tied for 5th and 9th place. See subject scores breakdown and number tested for further delineation.
- Carol Martin Gatton Academy of Math and Science (32.6)
- The Craft Academy for Excellence in Science and Mathematics (29.6)
- duPont Manual High School (26.6)
- Beechwood High School (25.1)
- Highlands High School (23.5)
- North Oldham High School (23.5)
- Jackson City School (23.3.)
- J. Graham Brown High School (23.2)
- Model Laboratory High School (22.6)
- Murray High School (22.5)
- South Oldham High School (22.5)
How to Read This Sortable Table
- The default sort is by composite score from highest to lowest; to change the sorting order, click on the header by which you want to sort
- “Avg Score” is the composite ACT score from 0 to 36
- “English, Reading, Math, Science” refers to the school’s average scores in each subject test from 0 to 36
- “# Tested” refers to the number of students who sat for the test at each school
Kentucky ACT Scores 2019
| wdt_ID | School | Avg Score | English | Reading | Math | Science | # Tested |
|---|---|---|---|---|---|---|---|
| 1 | Carol Martin Gatton Academy of Math & Science | 32.6 | 33.0 | 33.0 | 31.8 | 31.9 | 92 |
| 2 | The Craft Academy for Excellence in Science and Mathematics | 29.6 | 29.9 | 30.9 | 27.7 | 29.5 | 54 |
| 3 | duPont Manual High | 26.6 | 27.6 | 27.4 | 25.1 | 25.8 | 461 |
| 4 | Beechwood High School | 25.1 | 26.5 | 25.7 | 24.2 | 23.4 | 113 |
| 5 | Highlands High School | 23.5 | 23.7 | 24.2 | 22.8 | 22.8 | 238 |
| 6 | North Oldham High School | 23.5 | 23.3 | 24.3 | 22.8 | 23.2 | 244 |
| 7 | Jackson City School | 23.3 | 25.3 | 24.4 | 21.4 | 21.6 | 14 |
| 8 | J. Graham Brown School | 23.2 | 24.0 | 24.4 | 21.0 | 23.0 | 50 |
| 9 | Model Laboratory High School | 22.6 | 22.7 | 23.2 | 21.6 | 22.3 | 50 |
| 10 | Murray High School | 22.5 | 22.2 | 22.8 | 22.4 | 21.9 | 110 |
| 11 | South Oldham High School | 22.5 | 22.0 | 23.0 | 22.0 | 22.4 | 328 |
| 12 | Atherton High | 22.0 | 21.8 | 23.2 | 20.9 | 21.5 | 343 |
| 13 | Paul Laurence Dunbar High School | 22.0 | 21.1 | 22.8 | 21.7 | 22.1 | 424 |
| 14 | Pikeville High School | 21.6 | 21.0 | 22.3 | 21.1 | 21.5 | 74 |
| 15 | Lafayette High School | 21.5 | 20.8 | 22.5 | 21.0 | 21.3 | 520 |
| 16 | Russell High School | 21.5 | 20.9 | 21.5 | 21.4 | 21.7 | 123 |
| 17 | Harlan High School | 21.3 | 21.3 | 22.7 | 19.8 | 20.9 | 43 |
| 18 | Larry A. Ryle High School | 21.3 | 20.4 | 21.5 | 21.1 | 21.5 | 484 |
| 19 | Louisville Male High | 21.3 | 21.0 | 22.0 | 20.4 | 21.3 | 498 |
| 20 | South Warren High School | 21.3 | 21.2 | 22.5 | 19.9 | 21.2 | 299 |
| 21 | Henry Clay High School | 21.1 | 20.1 | 21.9 | 20.8 | 21.2 | 479 |
| 22 | Randall K. Cooper High School | 21.1 | 20.6 | 21.4 | 20.5 | 21.4 | 321 |
| 23 | Campbell County High School | 21.0 | 20.4 | 21.9 | 20.6 | 20.9 | 325 |
| 24 | Elizabethtown High School | 21.0 | 20.5 | 21.6 | 20.2 | 21.0 | 157 |
| 25 | Walton-Verona High School | 21.0 | 20.8 | 21.8 | 20.2 | 20.6 | 131 |
| School | Avg Score | English | Reading | Math | Science | # Tested |
Get Prepared for the ACT with Piqosity
- Download free official ACT practice tests and review our answers explanations
- Register for a free Piqosity account to access our 10 full-length ACT practice tests
For the full datasets referenced in this article:
- US High School Graduating Class Data, ACT, Inc.
- Average ACT Scores by State – Graduating Class of 2020, ACT, Inc.
- Kentucky College Admissions Exam (ACT), 2018-2019, Kentucky Department of Education
