census data
Massachusetts graduating seniors are the smartest in the country according to ACT’s recently released report, “The Condition of College and Career Readiness 2016.” Nevadans were the worst off with an average score of just 17.7, which is over 3 points lower than the national average of 21 (the complete list of states follows below).
Over 2 million American graduates took the ACT for 2016. At 2,090,342, this number represents an 8.6% growth in the ACT’s popularity compared to 2015 and is approximately 64% of the US graduating population.
(In the map above, the dark blue states are those that have a state-wide partnership with ACT)
ACT Benchmark Scores for Determining Success in College
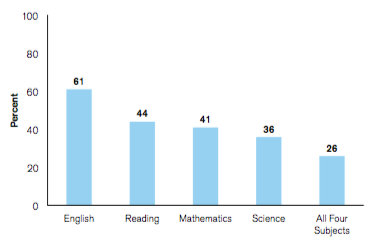
Percent of 2016-Tested High School Graduates Meeting ACT College Readiness Benchmarks by Subject (ACT Inc.)
“ACT College Readiness Benchmarks” are the subtest scores (out of 36) that the ACT thinks are necessary for a student to have a 50% chance of earning a B or higher or a 75% chance of getting a C or higher on a freshman level college course. Effective of 2013, these benchmark scores and their college course equivalents are are:
- English (English Composition) – 18
- Social Sciences (Social Sciences) – 22
- Mathematics (College Algebra) – 22
- Science (Biology) – 23
Using these benchmark scores, only 26% of ACT graduating seniors are prepared to succeed in college across all four disciplines. Students were most prepared in English (61%) and least prepared in the sciences (36%).
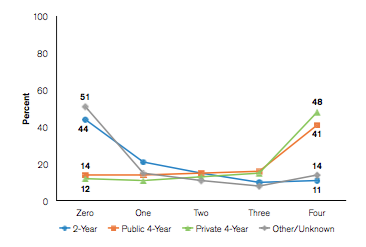
Percent of 2015 ACT-Tested High School Graduates by Number of ACT College Readiness Benchmarks Attained and Fall 2015 College Enrollment Status (ACT Inc.)
It should come as no surprise that students passing all four benchmarks (English, Reading, Mathematics, and Science) were most likely to attend 4-year private and public colleges.
48% of students passing all four benchmarks ultimately attended private 4-year colleges while 41% attended 4-year public colleges.
Disappointingly, 51% of students who didn’t pass any benchmarks fell off of the college radar altogether.
How to Read This Sortable Table
- The default sort is by highest composite score from highest to lowest; to change the sorting order, click on the header that you want to sort by
- “% Tested” refers to the estimated percentage of seniors who took the ACT
- “Avg Score” is the composite ACT score from 0 to 36
- “% Rank” shows the percentage of students who scored lower
- “% at – BM” is the percentage of students at or above the ACT’s Benchmark for that test
ACT Test Scores by State, Percent Tested, Composite Score, and Sub-Test Benchmarks for the Graduating Class of 2016
Note that the average composite score on the ACT nationwide is a 21, which is below the ACT’s benchmark in every subject except for English.
| Rank | State | % Tested | Avg Score | %Rank | % at English BM | % at Reading BM | % at Math BM | % at Science BM |
|---|---|---|---|---|---|---|---|---|
| 1 | Massachusetts | 28 | 24.8 | 79 | 85 | 71 | 74 | 61 |
| 2 | Connecticut | 34 | 24.5 | 79 | 85 | 68 | 68 | 61 |
| 3 | New Hampshire | 23 | 24.5 | 79 | 86 | 69 | 70 | 61 |
| 4 | New York | 29 | 23.9 | 74 | 79 | 65 | 67 | 58 |
| 5 | Maine | 10 | 23.6 | 74 | 81 | 63 | 66 | 54 |
| 6 | Delaware | 21 | 23.6 | 74 | 80 | 65 | 61 | 52 |
| 7 | Vermont | 29 | 23.4 | 68 | 80 | 62 | 62 | 54 |
| 8 | Virginia | 31 | 23.3 | 68 | 78 | 63 | 59 | 53 |
| 9 | Rhode Island | 20 | 23.3 | 68 | 79 | 62 | 60 | 52 |
| 10 | Washington | 25 | 23.1 | 68 | 73 | 60 | 61 | 52 |
| 11 | Pennsylvania | 23 | 23.1 | 68 | 77 | 61 | 61 | 52 |
| 12 | New Jersey | 32 | 23.1 | 68 | 75 | 59 | 61 | 50 |
| 13 | Maryland | 27 | 23.0 | 68 | 74 | 59 | 57 | 51 |
| 14 | Idaho | 39 | 22.7 | 68 | 77 | 60 | 54 | 46 |
| 15 | California | 33 | 22.6 | 68 | 72 | 55 | 56 | 45 |
| 16 | Indiana | 41 | 22.3 | 63 | 72 | 56 | 53 | 46 |
| 17 | Washington DC | 44 | 22.2 | 63 | 61 | 52 | 47 | 45 |
| 18 | Iowa | 68 | 22.1 | 63 | 73 | 55 | 48 | 46 |
| 19 | Ohio | 73 | 22.0 | 63 | 69 | 53 | 49 | 45 |
| 20 | South Dakota | 76 | 21.9 | 63 | 70 | 53 | 51 | 46 |
| 21 | Kansas | 74 | 21.9 | 63 | 70 | 53 | 48 | 43 |
| 22 | Oregon | 39 | 21.7 | 63 | 67 | 51 | 49 | 42 |
| 23 | Nebraska | 88 | 21.4 | 56 | 68 | 48 | 43 | 40 |
| 24 | Minnesota | 100 | 21.1 | 56 | 61 | 45 | 46 | 40 |
| 25 | Georgia | 60 | 21.1 | 56 | 65 | 47 | 40 | 36 |
| 26 | Illinois | 100 | 20.8 | 56 | 64 | 42 | 41 | 36 |
| 27 | National | 64 | 20.8 | 56 | 61 | 44 | 41 | 36 |
| 28 | West Virginia | 67 | 20.7 | 56 | 67 | 46 | 32 | 33 |
| 29 | Colorado | 100 | 20.6 | 56 | 61 | 42 | 39 | 36 |
| 30 | Texas | 46 | 20.6 | 56 | 57 | 43 | 42 | 35 |
| 31 | Wisconsin | 100 | 20.5 | 56 | 60 | 41 | 41 | 37 |
| 32 | Oklahoma | 82 | 20.4 | 50 | 61 | 45 | 32 | 32 |
| 33 | Michigan | 100 | 20.3 | 50 | 60 | 40 | 36 | 35 |
| 34 | North Dakota | 100 | 20.3 | 50 | 58 | 41 | 38 | 33 |
| 35 | Montana | 100 | 20.3 | 50 | 56 | 41 | 38 | 32 |
| 36 | Utah | 100 | 20.2 | 50 | 59 | 42 | 35 | 33 |
| 37 | Missouri | 100 | 20.2 | 50 | 59 | 40 | 35 | 32 |
| 38 | Arkansas | 96 | 20.2 | 50 | 60 | 40 | 32 | 30 |
| 39 | Arizona | 58 | 20.1 | 50 | 55 | 39 | 38 | 31 |
| 40 | Wyoming | 100 | 20.0 | 50 | 58 | 38 | 33 | 31 |
| 41 | Alaska | 53 | 20.0 | 50 | 55 | 42 | 37 | 31 |
| 42 | Kentucky | 100 | 20.0 | 50 | 59 | 40 | 31 | 30 |
| 43 | Tennessee | 100 | 19.9 | 50 | 58 | 38 | 30 | 30 |
| 44 | Florida | 81 | 19.9 | 50 | 53 | 42 | 33 | 29 |
| 45 | New Mexico | 70 | 19.9 | 50 | 53 | 39 | 31 | 28 |
| 46 | Louisiana | 100 | 19.5 | 50 | 58 | 35 | 26 | 27 |
| 47 | North Carolina | 100 | 19.1 | 43 | 47 | 34 | 32 | 26 |
| 48 | Alabama | 100 | 19.1 | 43 | 51 | 34 | 23 | 24 |
| 49 | Hawaii | 94 | 18.7 | 43 | 46 | 30 | 30 | 23 |
| 50 | South Carolina | 100 | 18.5 | 43 | 44 | 30 | 25 | 21 |
| 51 | Mississippi | 100 | 18.4 | 36 | 46 | 27 | 20 | 19 |
| 52 | Nevada | 100 | 17.7 | 36 | 37 | 26 | 21 | 18 |
While just 7.1 scaled points separate top Massachusetts from bottom Nevada, this represents a difference of 44 percentile points. As a state, Massachussens scored better than 79% of test-takers while Nevadans scored worse than 70%. Click here to see the ACT national percentile ranks.
20 States That Require the ACT
Twenty states partner with the ACT to require that most if not all public and charter school juniors or seniors take the ACT. The average, non-weighted, composite score for these states was a 19.9, which is lower than the 22.2 for states that did not require testing. This discrepancy is likely due to the fact that testing-optional states’ scores skew favorably towards self-selecting college-bound students.
| Rank | State | % Tested | Avg Score | % Rank | % at English BM | % at Reading BM | % at Math BM | % at Science BM |
|---|---|---|---|---|---|---|---|---|
| 1 | Minnesota | 100 | 21.1 | 56 | 61 | 45 | 46 | 40 |
| 2 | Illinois | 100 | 20.8 | 56 | 64 | 42 | 41 | 36 |
| 3 | Colorado | 100 | 20.6 | 56 | 61 | 42 | 39 | 36 |
| 4 | Wisconsin | 100 | 20.5 | 56 | 60 | 41 | 41 | 37 |
| 5 | Michigan | 100 | 20.3 | 50 | 60 | 40 | 36 | 35 |
| 6 | North Dakota | 100 | 20.3 | 50 | 58 | 41 | 38 | 33 |
| 7 | Montana | 100 | 20.3 | 50 | 56 | 41 | 38 | 32 |
| 8 | Arkansas | 96 | 20.2 | 50 | 60 | 40 | 32 | 30 |
| 9 | Utah | 100 | 20.2 | 50 | 59 | 42 | 35 | 33 |
| 10 | Missouri | 100 | 20.2 | 50 | 59 | 40 | 35 | 32 |
| 11 | Wyoming | 100 | 20.0 | 50 | 58 | 38 | 33 | 31 |
| 12 | Kentucky | 100 | 20.0 | 50 | 59 | 40 | 31 | 30 |
| 13 | Tennessee | 100 | 19.9 | 50 | 58 | 38 | 30 | 30 |
| 14 | Louisiana | 100 | 19.5 | 50 | 58 | 35 | 26 | 27 |
| 15 | North Carolina | 100 | 19.1 | 43 | 47 | 34 | 32 | 26 |
| 16 | Alabama | 100 | 19.1 | 43 | 51 | 34 | 23 | 24 |
| 17 | Hawaii | 94 | 18.7 | 43 | 46 | 30 | 30 | 23 |
| 18 | South Carolina | 100 | 18.5 | 43 | 44 | 30 | 25 | 21 |
| 19 | Mississippi | 100 | 18.4 | 36 | 46 | 27 | 20 | 19 |
| 20 | Nevada | 100 | 17.7 | 36 | 37 | 26 | 21 | 18 |
Race and Income Disparities
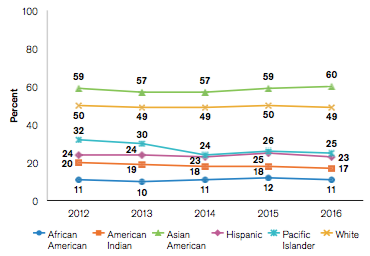
Percent of 2012-2016 ACT-Tested High School Graduates Meeting Three or More Benchmarks by Race/ Ethnicity
The ACT test results highlight big learning gaps between different race and ethnicities. While 60% of Asian Americans met at least three benchmarks, only 11% of African Americans did so. This achievement gap has remained nearly stagnant across the last five years.
Perhaps more worrying is that the gap between rich and poor is increasing. Between 2013 and 2016 students whose families earned more than $80,000 saw higher scores while the opposite was true for families less well to do.
Income differences explain some but not all of the gap. White families had a median household income of $60,256 in 2014 according to census data; black families were 41% lower at $35,398. By comparison, the ACT benchmark gap between whites and blacks is 78%. Making $42,491, Hispanics earned 29% less than whites while having 53% fewer students at benchmark.


[…] In 2016, 35,678 students took the ACT; their mean composite score was an 18.4 out of 36 meaning that the average Mississippi junior scored worse than 64% of other test takers. Nationwide, the average composite score was a 20.8. Of the 20 states with complete or near mandatory ACT testing, Minnesota scored the highest with a score of 21.1. Only Nevada scored worse than Mississippi with a composite score of 17.7. […]
These statistics are meaningless if you don’t account for the percentage of students who actually take the exam. 100% of students in Nevada vs. 28% in Massachusetts effectively makes this an apples to oranges comparison.
We agree that it’s important to know the selection size, which is why the first column of the table lists the estimated percentage of eligible students who took the ACT. Furthermore, we have a separate table for states with 100% participation.