Mississippi seniors remain among the least-prepared in the nation according to the class of 2019’s ACT scores; as much as 50% of Mississippi’s graduating class may not be ready for college. In fact, out of 240 public high schools, only one school—the Mississippi School for Mathematics and Science—graduated a majority of seniors whose test results indicated they were college-ready in all four ACT subject testing areas.
(Scroll down for table of ACT results from all 240 Mississippi public high schools)
In the 2019 graduating class, 36,438 Mississippi students took the ACT (about 1,000 fewer than last year), with a mean composite score of 18.4 out of a possible 36. This represents a slight downturn from 2018, when the mean composite was 18.6. Nationally, the average composite score was a 20.7 (also down from last year’s mean composite of 20.8).
Mississippi is one of 20 states which requires and pays for all public-school students to take the ACT in the spring of their junior year; ACT test scores account for 5% of a school’s annual accountability rating. This requirement means that Mississippi’s data is remarkably complete: it is estimated that 100% of students sat for the test.
In 16 other states, 95% or more of graduates took the ACT; among these, Minnesota ranked highest with an average score of 21.4, while Nevada ranked lowest—just below Mississippi—with an average of 17.9. Nationwide, the highest scores were found in Connecticut and Massachusetts, each with an average score of 25.5, but these states only tested 22% and 21% of graduates, respectively.
ACT Benchmark Scores Measure College Readiness
The ACT’s “College Readiness Benchmarks” are the scores (out of 36) on the subject area tests that indicate a student’s chances of college success. The ACT believes that meeting the benchmarks for English, Reading, Mathematics, and Science gives a student a 50% chance of earning a B or higher or a 75% chance of getting a C or higher in a corresponding freshman-level college course. Unchanged since 2013, these benchmark scores and their college course equivalents are:
- English (English Composition) – 18
- Reading (Social Sciences) – 22
- Math (College Algebra) – 22
- Science (Biology) – 23
Since 2015, the ACT has also offered a College Readiness Benchmark for coursework in STEM (science, technology, engineering, and math), based on scores on the Math & Science subject area tests. Because college-level STEM coursework tends to be more academically challenging (for instance, many STEM freshmen begin with Calculus instead of Algebra), ACT has determined that the benchmark ACT score is significantly higher for STEM than in other subject areas. Meeting the STEM benchmark indicates a 50% chance of earning a B or higher in identified college-level STEM courses. The benchmark score is:
- Math & Science (STEM) – 26
Majority of Mississippi Juniors are Not College Ready

Percent of Mississippi Students (dark blue) Compared to the Nation (light blue) Meeting College Benchmarks (ACT Inc.)
Appropriately for the state which has produced William Faulkner, Eudora Welty, and (more recently) Jesmyn Ward, Mississippi’s graduates are most prepared for college English, with 46% of students meeting the English benchmark, down slightly from 47% in 2018. Far fewer students met the benchmarks for the other subject areas, though: 29% in Reading, 20% in Math, and 19% in Science. Only 7% of graduates met the benchmark for STEM.
Similarly, English was the only subject test on which Mississippi students’ average score (18.1) was higher than the benchmark (18). On the other subject tests, average scores fell significantly below the benchmarks: 18.9 in Reading, 17.9 in Math, and 18.4 in both Science and STEM.
In all subject areas, the portion of college-ready Mississippi graduates lags behind the national average by more than 10%, and is less than half when looking at all four testing areas (12% of Mississippi students meet all four benchmarks; nationally that number is 26%).
Racial Disparities Exacerbate Mississippi’s Low ACT Scores
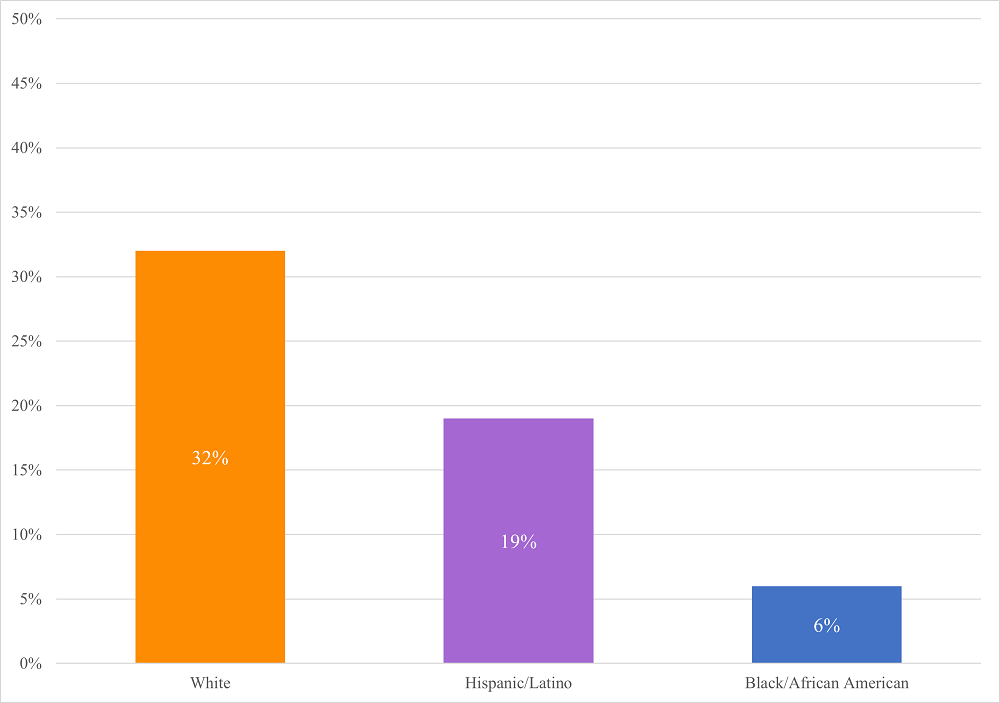
Percent of Mississippi 2019 ACT-Tested High School Graduates Meeting Three or More Benchmarks by Race/Ethnicity
Sadly, one of the biggest indicators of ACT success, both nationwide and in Mississippi, is one over which students have no control: their racial background.
Nationally, Asian Americans have the highest rates of success, followed by white students; students who identify as Black or African American score the lowest, just behind students with American Indian heritage. (Students who identify as either Hispanic or Pacific Islander score somewhere in the middle.)
The racial makeup of Mississippi’s graduating class shows the disparities most clearly between white and Black students: although they make up nearly equal proportions of the senior class (42% identify as white; 38% as Black), white students are more than five times more likely to meet three or more College Readiness Benchmarks than their Black peers.
Students Can Improve Their ACT Scores
Luckily for students looking to increase their chances of ACT success, there are several actions they can take which are statistically likely to improve their scores.
- Focus on schoolwork and take academically challenging classes. Students who do better in school nearly always do better overall on standardized tests like the ACT. For example, in 2019, Mississippi students taking physics were more than 10% more likely to pass the ACT Science benchmark than those who were not.
- Take the ACT more than once. There is a clear statistical advantage to retesting; in 2019, the average composite score of Mississippi graduates who took the ACT two or more times was 19.5, more than 3 points higher than the average composite score (16.2) of students who took the test only once. Students worried about the cost of retesting should consider ACT’s fee waiver program, which allows eligible students to test for free.
- Spend time studying and preparing specifically for the ACT. Taking practice tests helps students familiarize themselves with the content and the format of the test and gives them specific feedback. In addition, working with a tutor can be an effective way of improving a student’s weakest areas and developing test-taking strategies. Piqosity offers a full suite of free ACT Practice materials, perfect for students looking to increase their chances of ACT success.
Mississippi is also invested in helping its students who aren’t yet meeting benchmark goals. In 2019 in every subject area besides math, over 10% of the graduates who didn’t meet the benchmarks were within 2 points of doing so. In an effort to get those students the help they need, all Mississippi school districts are now required to offer two specialized classes to seniors who are just below benchmark scores. All students who earn at least an 80% in “Essentials for College Literacy” or “Essentials for College Math” are entitled to enter credit-bearing courses at all Mississippi public universities and community colleges.
Mississippi’s Colleges are Accessible and Affordable
Nearly three-quarters of Mississippi’s graduating seniors have college plans, and Mississippi is eager to help them get there. It is one of only nine states with some form of automatic admission.
At all eight of Mississippi’s public universities, an applicant will be granted full admission if they have a:
- High school GPA of 2.5 and score at least a 16 composite on the ACT OR
- High school GPA of 2.0 and score at least an 18 composite on the ACT
These are attainable goals; at two-thirds of Mississippi’s 240 public high schools, the majority of students earned a composite score of 16 or higher.
It’s not surprising, then, that 70% of Mississippi’s ACT score reports were sent to in-state public colleges. The top five colleges among test-takers were:
- Mississippi State
- University of Southern Mississippi
- University of Mississippi
- Mississippi Gulf Coast Community College
- Jackson State University
What’s more, these colleges are relatively inexpensive, too; all four universities are ranked among Mississippi’s Top 15 Most Affordable Colleges for in-state tuition, averaging a yearly cost of about $25,000. (Mississippi Gulf Coast Community College, which isn’t compared to public universities, is about half the cost, around $12,000 per year.) The costs are even lower once financial aid has been factored in: the Net Price—what students will actually owe—is as much as $10,000 less per year.
Top Mississippi High Schools by ACT Scores
Out of 240 public high schools, the majority of students were college-ready in English at 61 schools, but just 3 schools had a majority of college-ready students in Reading; only one school graduated a majority of seniors whose test results indicated they were ready for college Math and Science courses.
Top 10 Mississippi Public High Schools by ACT Scores (composite)
1. Mississippi School For Math & Science (28.8)
2. Madison Central High School (21.9)
3. Lewisburg High School (21.5)
4. Oxford High School(20.9)
5. Mississippi School Of The Arts (20.7)
5. Ocean Springs High School (20.7)
6. Clarkdale High School (20.6)
6. Northwest Rankin High School(20.6)
7. Desoto Central High School (20.5)
8. Biloxi High School (20.4)
9. Stringer Attendance Center (20.3)
10. Sebastopol Attendance Center (20.2)
How to Read This Sortable Table
- The default sort is by composite score from highest to lowest; to change the sorting order, click on the header by which you want to sort
- “Avg Score” is the composite ACT score from 0 to 36
- “English, Reading, Math, Science” refers to the school’s average scores in each subject test from 0 to 36
- “# Tested” is the number of students who sat for the exam at each school
| wdt_ID | School | AVG Score | English | Reading | Math | Science | # Tested |
|---|---|---|---|---|---|---|---|
| 1 | MISSISSIPPI SCHOOL FOR MATH & SCIENCE | 28.07 | 28.24 | 29.20 | 26.67 | 27.51 | 118 |
| 2 | MADISON CENTRAL HIGH SCHOOL | 21.76 | 21.53 | 22.32 | 21.06 | 21.61 | 365 |
| 3 | LEWISBURG HIGH SCHOOL | 20.59 | 19.46 | 20.86 | 20.93 | 20.71 | 296 |
| 4 | OXFORD HIGH SCHOOL | 21.01 | 21.15 | 21.18 | 20.69 | 20.56 | 281 |
| 5 | MISSISSIPPI SCHOOL OF THE ARTS | 22.07 | 23.56 | 24.56 | 18.51 | 21.00 | 41 |
| 6 | OCEAN SPRINGS HIGH SCHOOL | 20.76 | 20.27 | 21.43 | 20.19 | 20.62 | 405 |
| 7 | CLARKDALE HIGH SCHOOL | 19.77 | 20.93 | 19.83 | 18.68 | 19.17 | 71 |
| 8 | NORTHWEST RANKIN HIGH SCHOOL | 19.34 | 18.11 | 19.68 | 19.57 | 19.54 | 401 |
| 9 | DESOTO CENTRAL HIGH SCHOOL | 18.76 | 17.79 | 19.41 | 18.22 | 19.06 | 421 |
| 10 | BILOXI HIGH SCHOOL | 20.30 | 19.58 | 20.50 | 20.54 | 20.14 | 398 |
| 11 | STRINGER ATTENDANCE CENTER | 17.96 | 17.59 | 17.53 | 18.79 | 17.13 | 47 |
| 12 | SEBASTOPOL ATTENDANCE CENTER | 17.62 | 15.73 | 17.31 | 19.51 | 17.33 | 45 |
| 13 | GERMANTOWN HIGH SCHOOL | 19.63 | 18.91 | 20.36 | 18.55 | 20.29 | 287 |
| 14 | HERNANDO HIGH SCHOOL | 20.06 | 19.82 | 20.86 | 19.16 | 19.94 | 309 |
| 15 | CALEDONIA HIGH SCHOOL | 19.81 | 19.89 | 20.04 | 18.84 | 19.91 | 134 |
| 16 | GULFPORT HIGH SCHOOL | 19.33 | 18.90 | 19.54 | 18.92 | 19.39 | 315 |
| 17 | EAST CENTRAL HIGH SCHOOL | 19.69 | 19.42 | 19.64 | 18.99 | 20.18 | 173 |
| 18 | PETAL HIGH SCHOOL | 19.65 | 18.96 | 19.73 | 20.20 | 19.25 | 272 |
| 19 | VANCLEAVE HIGH SCHOOL | 20.21 | 20.13 | 20.67 | 19.33 | 20.27 | 168 |
| 20 | OAK GROVE HIGH SCHOOL | 19.89 | 19.46 | 20.38 | 19.44 | 19.78 | 381 |
| 21 | CLINTON HIGH SCHOOL | 19.30 | 18.73 | 19.71 | 18.70 | 19.56 | 359 |
| 22 | LONG BEACH HIGH SCHOOL | 19.41 | 18.65 | 19.73 | 19.05 | 19.61 | 208 |
| 23 | DIBERVILLE HIGH SCHOOL | 19.01 | 18.88 | 19.00 | 18.19 | 19.35 | 288 |
| 24 | PASS CHRISTIAN HIGH SCHOOL | 20.13 | 20.20 | 20.33 | 19.17 | 20.38 | 143 |
| 25 | CENTER HILL HIGH SCHOOL | 19.25 | 18.21 | 19.30 | 19.74 | 19.32 | 240 |
| School | AVG Score | English | Reading | Math | Science | # Tested |
For the full datasets referenced in this article:
- ACT Results of Mississippi Juniors 2019, Mississippi Department of Education
- The Condition of College and Career Readiness 2019: Mississippi Key Findings, ACT, Inc.
- The Condition of College and Career Readiness 2019, ACT, Inc.
