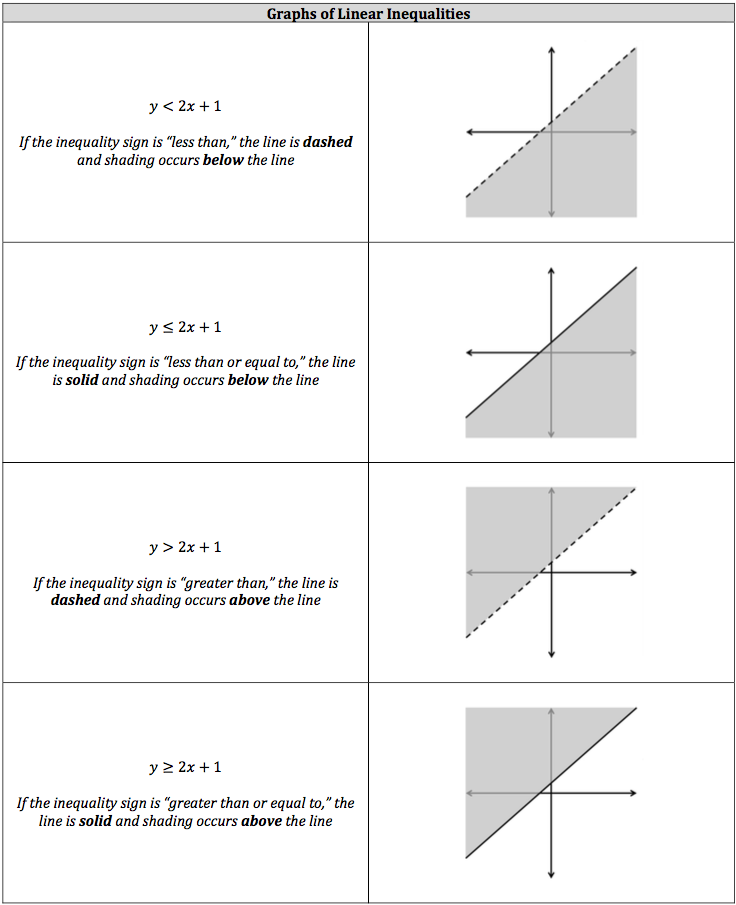
Now, graphing a linear inequality is very similar to graphing a linear equation, since you follow all the same rules for slope and the y‐intercept. However, the graph will look different. A linear equation has one input resulting in one output, while a linear inequality has one input resulting in many outputs. Essentially, the rules for graphing an inequality on a number line are the same for graphing a linear inequality on a graph. The inequality’s sign will determine the look of the line (solid or dashed) and what direction shading occurs. A linear inequality is accompanied by shading to represent the possible outputs that occur when the possible outputs are not limited to the line.
Again, the process for drawing the line for a linear inequality is the same as drawing a line for a linear equation. You find the slope of a linear inequality the same way as a linear equation. If the slope of the linear inequality is positive, the line will slope upwards. If the slope of the linear inequality is negative, the line will slope downwards. The only difference is how you draw the line, which depends on the inequality sign. Also, there will be many possible y‐intercepts, but you can designate the possible values the same way as linear equations (just make sure to include the inequality sign).
You will not be graphing linear inequalities as this is a multiple‐choice test. However, you will need to know what the graph of a linear inequality will look like.