Kansas’ Class of 2019 is better prepared for college than their peers nationwide, analysis of their ACT scores reveals. In the 2019 graduating class, 25,684 Kansas students took the ACT; their mean composite score was a 21.2 out of a possible 36. For comparison, 2018’s graduating class had about 500 fewer students and scored slightly higher, with a mean composite of 21.6. Nationally, the average composite score was a 20.7 (also down from 2018’s mean composite of 20.8).
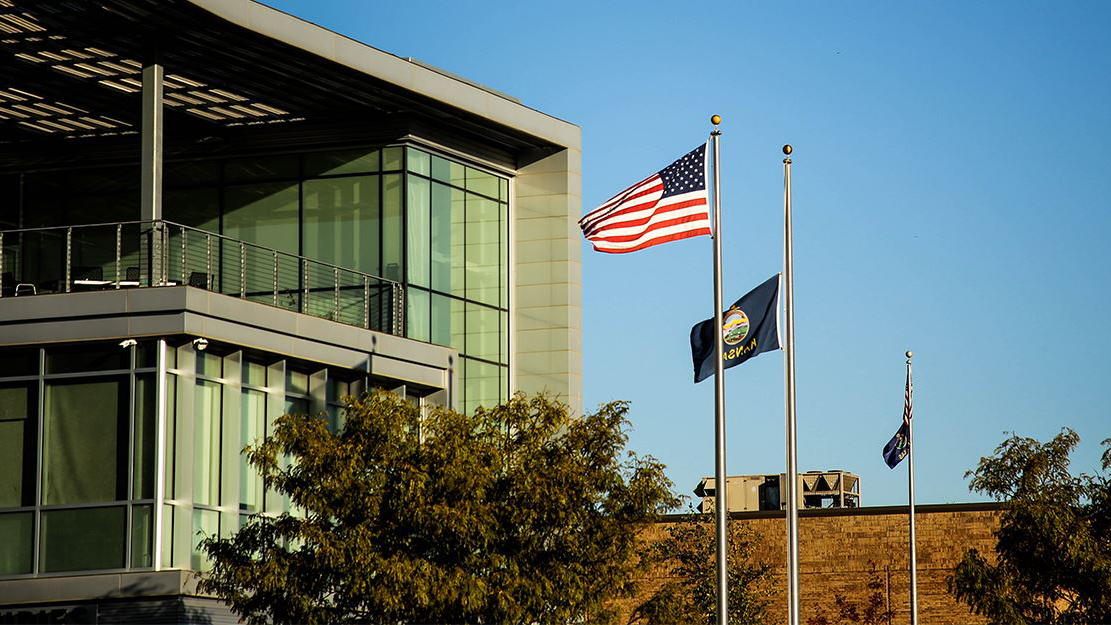
(Top image caption – Blue Valley Schools in Overland Park took the top 3 public school spots.)
In 2018, the Kansas Legislature approved funding for the Kansas State Department of Education to enter into a contract with ACT. Every Kansas high school student can now take the ACT once for free. State officials hope that by removing financial barriers for students who previously could not afford to take the test, the rate of ACT-takers will increase.
But as the level of testing increases, score averages are likely to fall, since they will include results from students whose future plans may not include college-level coursework. In states where standardized testing like the ACT is optional, most of the test-takers are a self-selecting, academically advanced group of students. For example, Connecticut and Massachusetts had the highest average ACT scores in the nation (both 25.5) in 2019, but only tested 22% and 21% of graduates, respectively.
ACT Benchmark Scores Measure College Readiness
The ACT’s “College Readiness Benchmarks” are the scores (out of 36) on the subject area tests that indicate a student’s chances of college success. The ACT believes that meeting the benchmarks for English, Reading, Mathematics, and Science gives a student a 50% chance of earning a B or higher or a 75% chance of getting a C or higher in a corresponding freshman-level college course. Unchanged since 2013, these benchmark scores and their college course equivalents are:
- English (English Composition) – 18
- Reading (Social Sciences) – 22
- Math (College Algebra) – 22
- Science (Biology) – 23
Since 2015, the ACT has also offered a College Readiness Benchmark for coursework in STEM (science, technology, engineering, and math), based on scores on the Math & Science subject area tests. Because college-level STEM coursework tends to be more academically challenging (for instance, many STEM freshmen begin with Calculus instead of Algebra), ACT has determined that the benchmark ACT score is significantly higher for STEM than in other subject areas. Meeting the STEM benchmark indicates a 50% chance of earning a B or higher in identified college-level STEM courses. The benchmark score is:
- Math & Science (STEM) – 26
Many Kansas Juniors are College-Ready
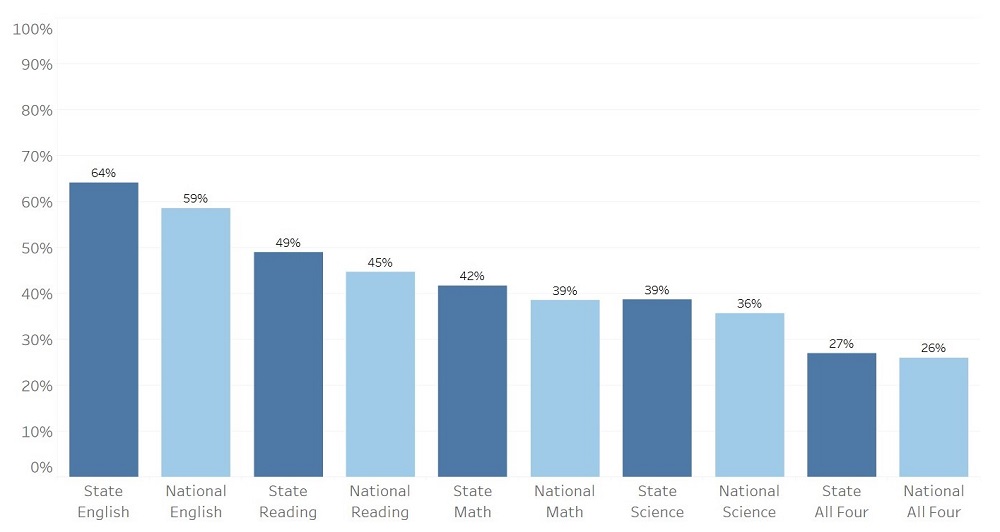
Percent of Kansas Students (dark blue) Compared to the Nation (light blue) Meeting College Benchmarks (ACT Inc.)
Across the board, Kansas graduates are meeting ACT College Readiness Benchmarks (CRBs) at notably higher rates than the national average. A clear majority of Kansas students (64%) are prepared for college English, and nearly half (49%) met the Reading benchmark. A significant number of students are college-ready in Math (42%) and Science (39%), too. Over one-fourth of students (27%) met all four CRBs, and 41% of students met benchmarks in three or more areas.

Breakdown of 2019 Kansas Graduates by College Benchmark Attainment (ACT Inc.)
There’s more good news, too: in 2019 in every subject area besides math, at least 10% of the graduates who didn’t meet the benchmarks were within 2 points of doing so. If just these students’ scores could be brought up to benchmark levels, Kansas would have over 50% of students passing every CRB (and nearly three-fourths meeting the English benchmark!).
Compared to the class of 2018, this set of graduates showed slightly less college preparedness in all areas. The average scores of 2019 students dropped by 0.5 points in English and Reading and by 0.4 points in Math and Science. As mentioned above, this is likely due in part to an increase in the number of students taking the ACT.
The chart below shows Piqosity’s analysis of the relationship between the number of tested students and their average composite scores.
As we can clearly see, as the number of students being tested has increased, the average scores have fallen. This trend is not unexpected. Consider Kansas’ northern neighbor Nebraska, which tested approximately 100% of graduates in 2019; their average score was a 20.0. As Kansas looks to increase its participation—from 72% in 2019—it may expect to see similar scores.
Racial Disparities are Present in Kansas ACT Scores
Sadly, one of the biggest indicators of ACT success is one over which students have no control: their racial background. Nationally, Asian Americans have the highest rates of success, followed by white students. Students who identify as Black or African American score the lowest, just behind students with American Indian heritage. (Students who identify as either Hispanic or Pacific Islander score somewhere in the middle.)
These nationwide trends are mirrored in Kansas’ 2019 results. 54% of Asian students and 48% of white students met three or more College Readiness Benchmarks, but only 13% of Black students and 21% of Latino graduates did so. It’s worth noting that the achievement gap between the highest and lowest scoring groups (Asian and Black students, respectively) is notably smaller in Kansas (41%) than it is nationwide (51%).
The significance of these results is skewed somewhat by the racial makeup of the graduating class:
- White – 65%
- Hispanic/Latino – 15%
- Black/African American – 5%
- Asian – 4%
In other words, Kansas could close the achievement gap by raising the scores of about 520 Black students, and just over 1,250 Hispanic students.
How to Improve ACT Scores
Luckily for students of all races looking to increase their chances of ACT success, there are several actions they can take which are statistically likely to improve their scores.
- Focus on schoolwork and take academically challenging classes. Students who do better in school nearly always do better overall on standardized tests like the ACT. For example, in 2019, 47% of Kansas students who had taken three or more years of high school math met the ACT Math CRB. For comparison, only 9% of students who had taken less than three years of math met the benchmark.
- Take the ACT more than once. There is a clear statistical advantage to retesting; in 2019, the average composite score of Kansas graduates who took the ACT two or more times was 23.0, over 4 points higher than the average composite score (18.7) of students who took the test only once. Students worried about the cost of retesting should consider ACT’s fee waiver program, which allows eligible students to test for free.
- Spend time studying and preparing specifically for the ACT. Taking practice tests helps students familiarize themselves with the content and the format of the test and gives them specific feedback. In addition, working with a tutor can be an effective way of improving a student’s weakest areas and developing test-taking strategies. Piqosity offers a full suite of free ACT Practice materials, perfect for students looking to increase their chances of ACT success.
Kansas Colleges are Accessible and Affordable
The overwhelming majority (81%) of Kansas’ Class of 2019 aspire to postsecondary education, with nearly half aiming for a four-year bachelor’s degree. There’s good news for parents worried about becoming empty-nesters: students sent the majority of their ACT score reports to public in-state colleges.
The top five colleges among test-takers were:
- Kansas State University
- University of Kansas
- Wichita State University
- Emporia State University
- Fort Hays State University
Being admitted to these schools is an attainable goal. At Kansas State, Wichita, Emporia, and Fort Hays, for instance, first-year applicants will qualify for admission if they earn:
- an ACT Composite Score of at least a 21.0, or
- a GPA of at least 2.25 (3.25 for Kansas State)
Applicants to the University of Kansas need either:
- an ACT score of 21.0 and a GPA of 3.25, or
- an ACT score of 24.0 and a GPA of 3.0
These are attainable goals—remember that the 2019 statewide average was a 21.2. Further, at 139 of Kansas’ 366 high schools, a majority of students scored above a 21.0.
Furthermore, these colleges are within the financial reach of many: all five rank within the Top 10 Most Affordable Colleges in Kansas.
Top Kansas High Schools by ACT Scores
The Kansas State Department of Education has made public the average Composite ACT scores of 366 high schools.
Top 10 Kansas High Schools by 2019 Average ACT Scores (composite)
1. St. John High School – Beloit (29.8)
2. Blue Valley North High (26.4)
3. Blue Valley High (25.4)
3. Blue Valley West High (25.4)
4. Hyman Brand Hebrew Academy (25.3)
5. Shawnee Mission East High (25.2)
5. James Academy (25.2)
6. Blue Valley Northwest High (24.9)
7. Olathe Northwest High School (24.9)
8. Thomas Aquinas High School (24.5)
How to Read This Sortable Table
- The default sort is by composite score from highest to lowest; to change the sorting order, click on the header by which you want to sort
- “Avg Score” is the composite ACT score from 0 to 36
Kansas 2019 ACT Scores
| wdt_ID | School Name | Avg Score |
|---|---|---|
| 1 | St John High | 29.80 |
| 2 | Blue Valley North High | 26.40 |
| 3 | Blue Valley High | 25.40 |
| 4 | Blue Valley West High | 25.40 |
| 5 | Hyman Brand Hebrew Academy | 25.30 |
| 6 | Shawnee Mission East High | 25.20 |
| 7 | St. James Academy | 25.20 |
| 8 | Blue Valley Northwest High | 24.90 |
| 9 | Olathe Northwest High School | 24.90 |
| 10 | St Thomas Aquinas High School | 24.50 |
| 11 | Lawrence Free State High | 24.40 |
| 12 | Blue Valley Southwest High School | 24.10 |
| 13 | Andover High | 23.90 |
| 14 | Mill Valley High School | 23.90 |
| 15 | Thomas More Prep-Marian | 23.90 |
| 16 | Andover Central High School | 23.80 |
| 17 | Kapaun Mt Carmel Catholic High | 23.80 |
| 18 | Bishop Miege High | 23.60 |
| 19 | Lawrence High | 23.50 |
| 20 | Natoma High (6-12) | 23.50 |
| 21 | Sacred Heart High [Salina] | 23.50 |
| 22 | Shawnee Mission South High | 23.50 |
| 23 | St Mary's Colgan High | 23.50 |
| 24 | Decatur Community Junior/Senior High | 23.40 |
| 25 | Uniontown High School | 23.40 |
| School Name | Avg Score |
For the full datasets referenced in this article:
- The Condition of College and Career Readiness 2019: Kansas Key Findings, ACT, Inc.
- The Condition of College and Career Readiness 2019, ACT, Inc.
- Kansas State Average Composite ACT Scores, 2015-2019, KSDE Report Card
