Students from Broadview High School in Broadview, MT had the highest average composite ACT score in Montana’s Class of 2022 with an average of 24.5, putting them in the nation’s 78th-percentile rank in on this list of the top Montana high schools by ACT scores. Just a few points behind the shiniest gem in The Treasure State—that is, Broadview High—are Loan Peak High School and Power High School, neck-in-neck with scores of 22.9 and 22.8.
Although it’s only one metric, a school’s average ACT scores can reveal a lot. They are usually a reliable indicator of college- and career-readiness, and the “best” high schools are those which adequately prepare their students for college or a career. This article looks at general trends in Montana’s 2022 ACT scores with a focus on the top-scoring high schools across the state.
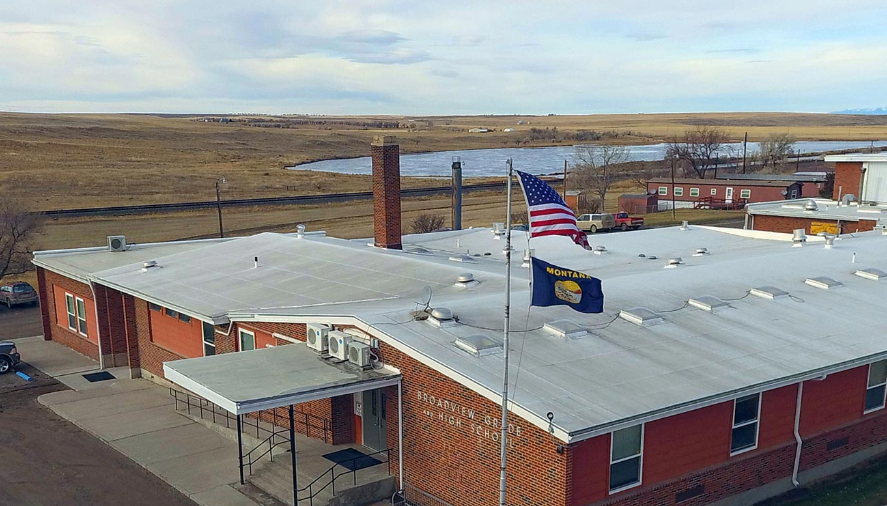
(Top image caption—Broadview High School in Yellowstone County has Montana’s highest average ACT scores.)
Montana’s Class of 2022 included 9,341 students who took the ACT; they scored a mean composite of 19.3 out of a possible 36. For reference, 2019’s graduating class (the largest on record) had about 650 more students and scored slightly higher, with a mean composite of 19.8. Nationally, the average composite score in 2022 was 19.8 (down from 2020’s mean composite of 20.6).
For nearly 10 years (since 2014), Montana has administered the ACT to all high school juniors. Consequently, the state’s data is remarkably complete (save for 2021—as a result of the pandemic, all states’ overall percentage of students tested dropped in 2020/21). In 2022, it was one of 8 states where between 90-99% of graduates took the ACT; among these, it ranked third (with an average composite of 19.3). Of the other states in this range, Utah had the highest average score (testing 91% with an average score of 19.9), Nebraska and Wisconsin tied for second place (testing 94% and 93% respectively, scoring an average of 19.4), and Oklahoma ranked last (testing 94% of students with a score of 17.9).
To more fully contextualize this, it’s important to acknowledge that states with higher testing levels tend to have lower average scores. One main reason for this is that they include results from students whose future plans may not include college-level coursework. In states where standardized testing like the ACT is optional, test-takers are primarily a self-selecting, academically advanced cohort, which is reflected in their test scores. Consider, for example, Washington D.C and Massachusetts, which had the highest average ACT scores in the nation (26.9 and 26.5), but administered tests to only 18% and 9% of graduates, respectively.
ACT College Readiness Benchmarks
The ACT’s “College Readiness Benchmarks” are the scores (out of 36) on the subject area tests that indicate a student’s chances of college success. The ACT believes that meeting the benchmarks for English, Reading, Mathematics, and Science gives a student a 50% chance of earning a B or higher or a 75% chance of getting a C or higher in a corresponding freshman-level college course. Unchanged since 2013, these benchmark scores and their college course equivalents are:
- English (English Composition) – 18
- Reading (Social Sciences) – 22
- Math (College Algebra) – 22
- Science (Biology) – 23
Since 2015, the ACT has also offered a College Readiness Benchmark for coursework in STEM (science, technology, engineering, and math), based on scores on the Math & Science subject area tests. Because college-level STEM coursework tends to be more academically challenging (for instance, many STEM freshmen begin with Calculus instead of Algebra), ACT has determined that the benchmark ACT score is significantly higher for STEM than in other subject areas. Meeting the STEM benchmark indicates a 50% chance of earning a B or higher in identified college-level STEM courses. The benchmark score is: Math & Science (STEM) – 26
Many Montana Juniors are Not College-Ready
Montana’s Class of 2022 lags behind the national average for students meeting ACT College Readiness Benchmarks (CRBs). Montana graduates are most college-ready in English, with about half (48%) of graduates meeting the CRB, but the numbers are lower in other subject areas. 37% of students met the Reading benchmark, and under a third are college-ready in Science (29%) and Math (28%).
Compared to the class of 2020, this set of graduates showed a slightly lower level of college preparedness across the board. The average scores of the class of 2022 have declined 3% in English, 7% in Math, 2% in Reading, and 1% in Science—the average scores of 2022 students across the entire nation have declined, so this isn’t an issue specific to Montanans.
Montana’s Racial & Economic Achievement Gaps
Nationally, there is a concerning correlation between a student’s racial background and their likelihood of achieving ACT CRBs. In general, Asian Americans have the highest rates of success, followed by white students. Students who identify as Black or African American score the lowest (Hispanic students, and students of other races, score somewhere in the middle.) It is important to emphasize that this is not a causative relationship. Black students do not score worse than white students, on average, because they are Black; rather, it is that many factors which negatively impact ACT scores tend to disproportionately affect non-white (and non-Asian) students.
Montana’s 2022 results reveal a similar racial achievement gap, and it’s important to note that Montana is overwhelmingly white—just under 7,000 white students in Montana took the ACT in 2022, while 597 Hispanic students, 85 Asian students, and only 52 Black students took the exam. In Montana, 34% of Asian students and 32.5% of white students met three or more CRBs, while 17% of Hispanic students and only 3.8% of Black students did the same.
Closing the achievement gap will take work, but it is an attainable goal. For instance, if Montana wanted to achieve parity in college readiness between white and Black students, they would only need to improve the scores of about 15 Black students. In order to do the same for the disparity between white and Hispanic students, they’d need to improve the scores of around 92 Hispanic students.
In addition to race, a student’s economic status is often closely related to their ACT performance. Nationwide, the achievement gap between students whose family income is less than $36,000 a year (classified as “low income”) and those whose family income exceeds that amount is very wide: when comparing students who meet 3 or more CRBs, 20 percentage points separate the two groups. In Montana, this gap is notably smaller—around 13 percentage points—but still shows room for improvement.
How to Improve ACT Scores
Luckily for students of all racial and economic backgrounds looking to increase their chances of ACT success, there are several actions they can take which are statistically likely to improve their scores.
- Focus on schoolwork and take academically challenging classes. Students who do better in school nearly always do better overall on standardized tests like the ACT. For instance, 2022 Montana seniors who took a full four years of English scored an average of 4 full points better on the English ACT than those who had taken less than four years of English classes.
- Take the ACT more than once. There is a clear statistical advantage to retesting, even according to the ACT. In 2022, Montana students who took the ACT two or more times were three times more likely to meet all four college readiness benchmarks, compared to those who took the test only once. Students worried about the cost of retesting should consider ACT’s fee waiver program, which allows eligible students to test for free.
- Spend time studying and preparing specifically for the ACT. Taking practice tests helps students familiarize themselves with the content and the format of the test and gives them specific feedback. In addition, working with a tutor can be an effective way of improving a student’s weakest areas and developing test-taking strategies. Piqosity offers a full suite of free ACT Practice materials and analyses of previously-released ACT tests, perfect for students wondering how to improve their ACT scores.
Montana’s Colleges are Popular and Affordable
It is difficult to say what most Montanans graduates’ post-secondary aspirations are; 80% of students declined to indicate their future educational plans, but most students indicated the colleges they want their scores sent to at the time of testing. The majority of students sent their scores to Montana colleges (popular out-of-state picks included Arizona State University, the University of Washington, and the University of Oregon)—most of the class of 2022 sent their scores to:
- Montana State University—Bozeman
- University of Montana
- Montana State University—Billings
- Montana Technological University (University of Montana system)
- Carroll College
Admission to these schools is an attainable goal. For instance, at MSU Bozeman, a student will be guaranteed admission with:
- a GPA of 2.5 or
- a top 50% class rank or
- an SAT total score of 1120 or
- an ACT Composite Score of 22
Regardless of where students end up, Montana colleges are well within the financial reach of many students—for instance, all of the five schools listed above rank within the Top 20 Most Affordable Colleges at which to obtain a bachelor’s degree in MT.
The Top Montana High Schools by ACT Scores
The table below presents 2022 ACT Scores from 152 Montana high schools for which full data was available. Explore the original data from the Montana Office of Public Instruction here. Two schools tied for fourth place and two tied for fifth.
Top 10 Montana High Schools by 2022 Average ACT Scores (composite)
- Broadview High School (24.5)
- Lone Peak High School (22.9)
- Power High School (22.8)
- Terry High School (22.6)
- Absarokee High School & Nashua High School (22.4)
- Manhattan High School & Gardiner High School (22.0)
- Bozeman High School (21.8)
- Twin Bridges High School (21.4)
- Plevna High School (21.2)
- Highwood High School (21.0)
How to Read This Sortable Table
- The default sort is by composite score from highest to lowest; to change the sorting order, click on the header by which you want to sort
- “Avg Score” is the composite ACT score from 0 to 36
- “English, Reading, Math, Science” refers to the school’s average scores in each subject test from 0 to 36
- “# Tested” refers to the number of students who sat for the test at each school
| wdt_ID | District Name | School Name | Avg. Composite |
|---|---|---|---|
| 1 | Broadview H S | Broadview High School | 24.50 |
| 2 | Big Sky School K-12 | Lone Peak High School | 22.90 |
| 3 | Power H S | Power High School | 22.80 |
| 4 | Terry K-12 Schools | Terry High School | 22.60 |
| 5 | Absarokee H S | Absarokee High School | 22.40 |
| 6 | Nashua K-12 Schools | Nashua High School | 22.40 |
| 7 | Manhattan High School | Manhattan H S | 22.00 |
| 8 | Gardiner H S | Gardiner High School | 22.00 |
| 9 | Bozeman H S | Bozeman High School | 21.80 |
| 10 | Twin Bridges K-12 Schools | Twin Bridges High School | 21.40 |
| 11 | Plevna K-12 Schools | Plevna High School | 21.20 |
| 12 | Highwood K-12 | Highwood High School | 21.00 |
| 13 | Hobson K-12 Schools | Hobson High School | 20.90 |
| 14 | Belfry K-12 Schools | Belfry High School | 20.80 |
| 15 | Whitefish H S | Whitefish High School | 20.70 |
| 16 | Belt H S | Belt High School | 20.60 |
| 17 | Shields Valley H S | Shields Valley High School | 20.60 |
| 18 | Wibaux K-12 Schools | Wibaux High School | 20.60 |
| 19 | Reed Point H S | Reed Point High School | 20.50 |
| 20 | Big Sandy K-12 | Big Sandy High School | 20.40 |
| 21 | Drummond H S | Drummond High School | 20.40 |
| 22 | Plentywood K-12 Schools | Plentywood High School | 20.40 |
| 23 | Cascade H S | Cascade High School | 20.20 |
| 24 | Centerville H S | Centerville High School | 20.20 |
| 25 | North Star HS | North Star High School | 20.20 |
| District Name | School Name | Avg. Composite |
Get Prepared for the ACT with Piqosity
If you’re a student preparing for the ACT and looking for ways to improve your test readiness, Piqosity is here to help! Piqosity is a simple, all-in-one learning platform for students who want to score better on their ACT in less time. Our tools monitor your progress to tell you exactly what you need to practice to reach your desired score.
We offer a full suite of ACT test prep materials: 10 full-length ACT practice tests, over 70 distinct concept lessons, personalized practice software, and much more.
The best part? You can try out all of Piqosity’s features with our free community account. When you’re ready to upgrade, Piqosity’s year-long accounts start at only $89. Plus, get a 10% off coupon just by signing up for our mailing list!
For the full datasets referenced in this article:
- Average ACT Scores by State Graduating Class of 2022
- ACT Database for US ACT Score Trends in the Class of 2022
- 2022 ACT Scores for Montana High Schools
More Educational Resources from Piqosity:
