In the Illinois Class of 2023, 142,770 students took the SAT; their mean composite score was a 970 out of a possible 1600. For comparison, 2022’s graduating class had about 1,500 more students take the exam, and they scored slightly higher with a mean composite of 981. Nationally, the average composite score was 1028 (down from 2022’s mean composite of 1050).
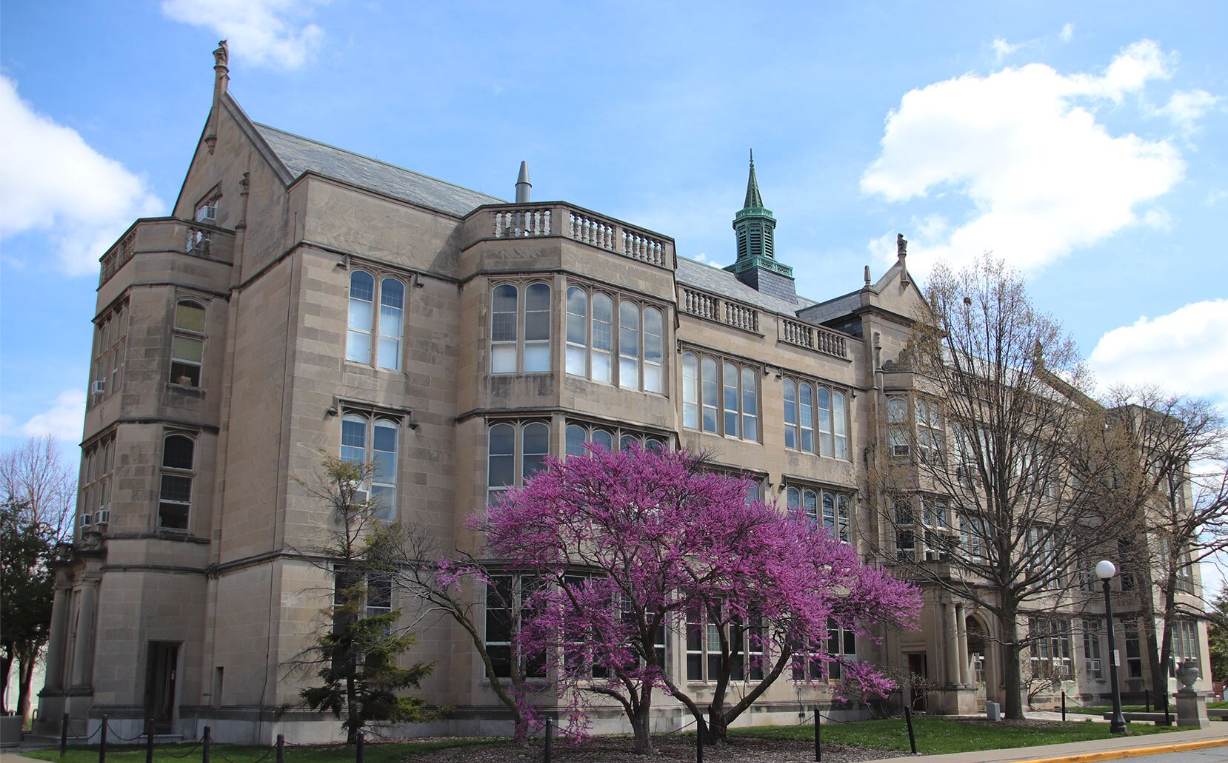
(Top image caption—the University of Illinois High School, located on the University of Illinois at Urbana Champaign campus about two hours south of Chicago, has the highest average SAT scores in the state of Illinois.)
SAT scores can be an effective indicator of students’ college and career readiness, and the best high schools are those that adequately prepare students for higher education or a career. As such, if you’re wondering what the top Illinois high schools are, it’s a good idea to look at those with the best SAT scores in the state. This article looks into general trends in Illinois’ SAT scores from the class of 2023, focusing on the best high schools across the Prairie State!
Illinois Scores in Context
Illinois is one of several states with standardized testing requirements—since 2017, it has required all public school students to take the SAT their junior year. In 2022, Illinois tested 97% of its students—one of 12 states where more than 90% of graduates took the ACT (Michigan also tested 97% of students, while Washington D.C. and Indiana tested 100%). Of those twelve states, it had the third-highest average composite SAT score (only surpassed by Connecticut, with a mean score of 1007 testing 93% of students, and Colorado, which had an average mean score of 996 testing 90% of students).
What’s important to note is that Illinois tested the second-highest number of students out of the states that tested over 90% of juniors. Three had more than 100,000 juniors take the SAT in 2022: Florida (over 200,000), Illinois (around 145,000), and Michigan (just over 102,000). It’s impressive that Illinois outscored not only its high-population peers, but even all states that tested ≥90% with fewer than 40,000 testers.
In general, states with higher testing levels tend to have lower average scores. This is shown in the graph below, which plots the average SAT scores of all 50 states (plus the District of Columbia) against the percentage of graduates who were tested.
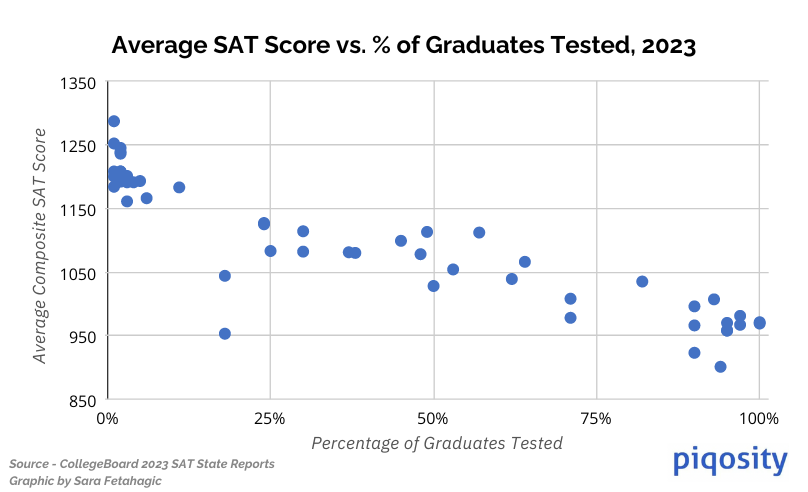
Although the data is not perfectly linear (real-life data rarely is), there is a clear correlation between higher levels of testing and lower average scores. One main reason for this is that they include results from students whose future plans may not include college-level coursework. (In some cases, these students will “take” the test but not actually complete it, resulting in artificially low scores).
In states where standardized testing like the SAT is optional, most test-takers are self-selecting and academically advanced, which is reflected in their test scores. For example, consider North Dakota and Nebraska, which had the highest mean composite SAT scores in the nation (1287 and 1252), but which each only tested 1% of graduates. No states that tested more than 11% of students earned a higher mean score than 1150. With this context, Illinois’ high ranking among states with over 90% participation is quite impressive.
SAT College and Career Readiness Benchmarks
The SAT’s College and Career Readiness Benchmarks (CRBs) are the scores on each SAT subject area that indicate a student’s chance of college success. When a student meets both the Reading and Writing benchmark and the Math benchmark, they are considered college-ready in both subjects.
According to the College Board, students that meet or exceed the SAT Math benchmark score have a 75% chance of earning a C or higher in their first-college-semester math courses. The same goes for students that meet or exceed the Reading and Writing benchmark for the humanities courses (such as history, literature, or social sciences) in their first semester of college. These benchmark scores are:
- Reading and Writing: 480
- Math: 530
Of course, students that score below these benchmarks can still have success in college, so long as they study and persevere. Still, they are a reliable metric to evaluate student college-readiness of individuals and groups of students.
Are Illinois Students College-Ready?
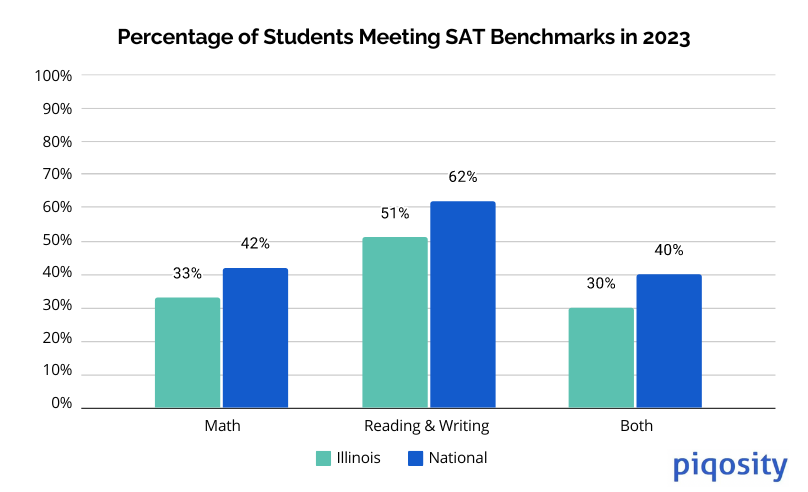
Above: Percent of Illinois students (teal) compared to the nation (blue) meeting SAT College Readiness Benchmarks (College Board SAT Suite Annual Reports).
With an average SAT Math score of 478 and an average Reading and Writing score of 492, Illinois trails the national average when it comes to meeting SAT Career and College-Readiness Benchmarks. More than half of Illinois students (51%) met the Reading and Writing benchmark and only a third (33%) met the Math benchmark. 30% of Illinois’ 2023 graduates met both benchmarks. When compared to national averages, Illinois students are generally ten percent behind across these benchmarks.
Despite lagging behind the nation when it comes to meeting CRBs this year, Illinois students are faring better when comparing 2023 and 2022 figures. When compared to the Class of 2022, this set of Illinois graduates showed only 1% less preparedness in Reading and Writing (52% met this benchmark in 2022) and 1% more in Math (32% met the Math benchmark last year). Nationally, 3% fewer students met the Math and the Reading and Writing benchmarks this year than last year.
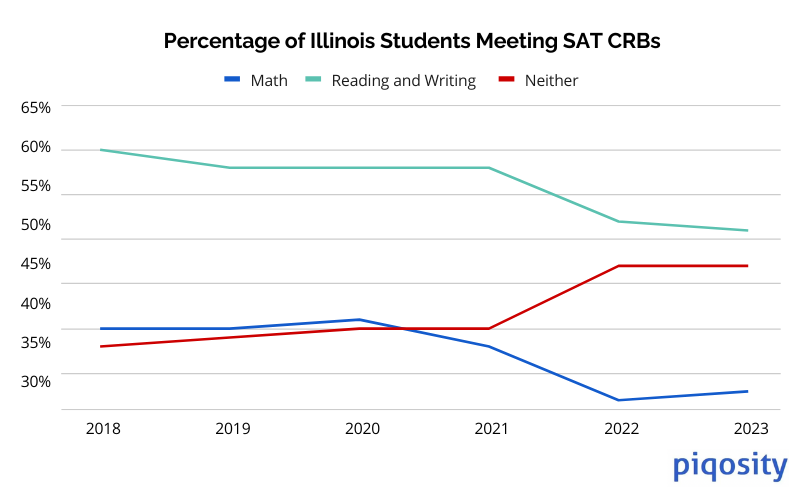
Illinois has not been immune to the national decline, but this trend has slowed in the state this year—the chart below illustrates the amount of graduates meeting CRBs since Illinois began administering the SAT to all students.
Illinois SAT Scores Show a Racial Achievement Gap
Nationally, there is a concerning correlation between a student’s racial background and their likelihood of SAT success. In general, Asian American students have the highest rates of success, followed by white students. Students who identify as Black or African American score the lowest (Hispanic students, and students of other races, generally score somewhere in the middle.) It is important to emphasize that this is not a causative relationship. Black students do not score worse than white students on average because they are Black; rather, it is that many factors which negatively impact SAT scores tend to disproportionately affect non-white (and non-Asian) students.
Illinois’ 2023 SAT results mirror these nationwide disparities—while 51% of white students and 68% of Asian students met both SAT College Readiness Benchmarks in Illinois, only 12% of Black students and 21% of Latino students did the same. Considering that the racial/ethnic makeup of Illinois’ Class of 2023 is similar to that of the national graduating class, the fact that 5% fewer Black students in Illinois met both CRBs than in the nation shows a concerning gap.
To put it in terms of concrete numbers, if Illinois wanted to close the college readiness achievement gap between white and Black graduates, they would need to improve the SAT scores of around 5,500 Black students.
How to Improve SAT Scores
Luckily for students of all backgrounds looking to increase their chances of SAT success, there are several actions they can take which are statistically likely to improve their scores. Remember that all students will be taking the Digital SAT going forward, so all test prep should be done with the new version of the exam in mind.
- Focus on schoolwork and take academically challenging classes. Students who do better in school nearly always do better overall on standardized tests like the SAT. Students hoping to improve their chances on the SAT should aim to take and do well in “core curriculum” math, English, and reading classes.
- Take the SAT more than once. There is a clear statistical advantage to retesting: in 2023, the mean composite score of Illinois students who took the SAT School Day and retook the SAT on a weekend was a 1206, more than 250 points above the average composite score of students who only took the School Day SAT (932). Students who are worried about the cost of retesting should look into SAT Fee Waivers, which allows eligible students to take the SAT.
- Spend time studying and preparing specifically for the SAT. Taking practice tests helps students familiarize themselves with the content and the format of the test and gives them specific feedback. In addition, working with a tutor can be an effective way of improving a student’s weakest areas and developing test-taking strategies. Piqosity’s online learning software emulates the personalization of one-on-one tutoring—together with a full suite of Digital SAT practice materials, our test prep program is perfect for students looking to increase their chances of SAT success.
Most Popular Illinois Colleges for SAT Examinees
Just under half (47%) of Illinois students in the Class of 2023 who took the SAT sent their SAT score reports to colleges. They overwhelmingly sent them to in-state colleges, save for Purdue University (in the neighboring state of Indiana), which was the #7 pick of Illinoian SAT-takers. Their top five selections were:
- University of Illinois at Urbana Champaign
- University of Illinois at Chicago
- Illinois State University
- Loyola University Chicago
- Northern Illinois University
While good SAT scores make any student an attractive candidate, all of these five consider students for admission without test scores (Northern Illinois University is test-blind, and it won’t consider submitted test scores). (Some require SAT scores if students wish to be considered for certain academic scholarships, and they may also use SAT scores to help determine class placement.)
Admissions to the top choice of Illinois students is quite competitive—an SAT score above 1340 is recommended for applicants to U of I Urbana Champaign. At U of I Chicago and Loyola University, the recommendation is above around 1130, and Illinois State’s typical score range is above 1020.
Top Illinois High Schools by SAT Scores
Four impressive Illinois high schools surpassed an average composite score of 1300, with a total of eleven scoring higher than 1200. The performance of all of these top high schools helped boost Illinois’ performance in comparison to the other states that tested over 90% of juniors last year. The table below presents average 2023 SAT scores from the 700 Illinois high schools for which full data was available. Explore the original data at the Illinois State Board of Education data library.
Top 10 High Schools in Illinois by 2023 Average Composite SAT Scores
- University of Illinois High School (1440.0)
- Illinois Mathematics and Science Academy (1379.1)
- Payton College Preparatory High School (1332.5)
- Northside College Preparatory High School (1302.4)
- Young Magnet High School (1289.6)
- Jones College Preparatory High School (1272.2)
- Lane Technical High School (1254.0)
- New Trier Township High School Winnetka (1216.2)
- Adlai E Stevenson High School (1211.7)
- Hinsdale Central High School (1211.7)
How to Read This Sortable Table
- The default sort is by composite score from highest to lowest; to change the sorting order, click on the header by which you want to sort.
- “Composite” is the average composite SAT score from 0 to 1600.
- “ERW” and “Math” refers to the school’s average scores in each SAT subject, Reading & Writing and Math, from 0 to 800.
| wdt_ID | School | District | Composite | ERW | Math |
|---|---|---|---|---|---|
| 1 | University of Illinois High School | University of Ill Lab School | 1,440.0 | 716.2 | 723.8 |
| 2 | Illinois Mathematics and Science Academy | Illinois Mathematics & Science Academy | 1,379.1 | 668.6 | 710.5 |
| 3 | Payton College Preparatory HS | City of Chicago SD 299 | 1,332.5 | 665.3 | 667.2 |
| 4 | Northside College Preparatory Hs | City of Chicago SD 299 | 1,302.4 | 652.5 | 649.9 |
| 5 | Young Magnet High School | City of Chicago SD 299 | 1,289.6 | 638.8 | 650.8 |
| 6 | Jones College Prep High School | City of Chicago SD 299 | 1,272.2 | 636.3 | 635.9 |
| 7 | Lane Technical High School | City of Chicago SD 299 | 1,254.0 | 627.1 | 626.9 |
| 8 | New Trier Township H S Winnetka | New Trier Twp HSD 203 | 1,216.2 | 612.4 | 603.8 |
| 9 | Adlai E Stevenson High School | Adlai E Stevenson HSD 125 | 1,211.7 | 597.9 | 613.8 |
| 10 | Hinsdale Central High School | Hinsdale Twp HSD 86 | 1,211.3 | 602.3 | 609.0 |
| 11 | Glenbrook North High School | Glenbrook HSD 225 | 1,204.7 | 597.0 | 607.7 |
| 12 | Deerfield High School | Twp HSD 113 | 1,181.3 | 593.5 | 587.8 |
| 13 | Neuqua Valley High School | Indian Prairie CUSD 204 | 1,168.8 | 580.0 | 588.8 |
| 14 | Wm Fremd High School | Township HSD 211 | 1,155.3 | 572.1 | 583.2 |
| 15 | Lake Forest High School | Lake Forest CHSD 115 | 1,146.8 | 572.5 | 574.3 |
| 16 | Vernon Hills High School | CHSD 128 | 1,145.3 | 564.2 | 581.1 |
| 17 | John Hersey High School | Township HSD 214 | 1,142.1 | 577.9 | 564.2 |
| 18 | Libertyville High School | CHSD 128 | 1,139.8 | 577.2 | 562.6 |
| 19 | University High School | ISU Laboratory Schools | 1,135.7 | 561.2 | 574.5 |
| 20 | Naperville Central High School | Naperville CUSD 203 | 1,135.4 | 568.2 | 567.2 |
| 21 | Glenbrook South High School | Glenbrook HSD 225 | 1,120.9 | 561.4 | 559.5 |
| 22 | Lake Zurich High School | Lake Zurich CUSD 95 | 1,117.6 | 559.0 | 558.6 |
| 23 | Dunlap High School | Dunlap CUSD 323 | 1,117.4 | 557.2 | 560.2 |
| 24 | Naperville North High School | Naperville CUSD 203 | 1,116.2 | 561.8 | 554.4 |
| 25 | Prospect High School | Township HSD 214 | 1,109.0 | 557.9 | 551.1 |
| School | District | Composite | ERW | Math |
Get Ready for the Digital SAT with Piqosity
If you’re a student preparing for the SAT and looking for ways to improve your test readiness, Piqosity is here to help! Piqosity is a simple, all-in-one learning platform for students who want to score better on their SAT in less time. Our tools monitor your progress to tell you exactly what you need to practice to reach your desired score.
Ahead of the all-new SAT, we offer a full suite of Digital SAT prep materials: 12 full-length Digital SAT practice tests, almost 500 Digital SAT practice questions with personalized practice software, over 50 instructional lessons, and much more.
The best part? You can try out all of Piqosity’s features with our free community account—plus, our Digital SAT practice tests are available at no cost while the course is under development. When you’re ready to upgrade, Piqosity’s year-long accounts start at only $89. Get a 10% off coupon just by signing up for our mailing list!
For the full datasets referenced in this article:
- 2023 Report Card Public Data Set (Illinois State Board of Education)
- National 2023 SAT Suite Annual Report
- 2023 SAT Suite Annual Report – Illinois
- Data Archive of SAT Suite Annual Reports
More Educational Resources by Piqosity:
