Students from Central Magnet School had the highest average composite ACT score in Tennessee’s Class of 2022 with an impressive average of 30.5, putting them in the nation’s 94th-percentile rank. Merrol Hyde Magnet School is the only other top Tennessee high school that made it in the top ninety percent of the nation’s ACT scores with an average score of 29.8, and Hume-Fogg High holds third place with an average sore of 27.2.
Although it’s only one metric, a school’s average ACT scores can reveal a lot. They are usually a reliable indicator of college- and career-readiness, and the “best” high schools are those which adequately prepare their students for college or a career. This article looks at general trends in Tennessee’s 2022 ACT scores with a focus on the top-scoring high schools across the state. Tennessee’s Class of 2022 included 80,603 students who took the ACT; they scored a mean composite of 18.6 out of a possible 36. For reference, 2019’s graduating class (the largest on record) had about 5,000 more students and scored higher, with a mean composite of 19.4. Nationally, the average composite score in 2022 was 19.8 (down from 2020’s mean composite of 20.6).
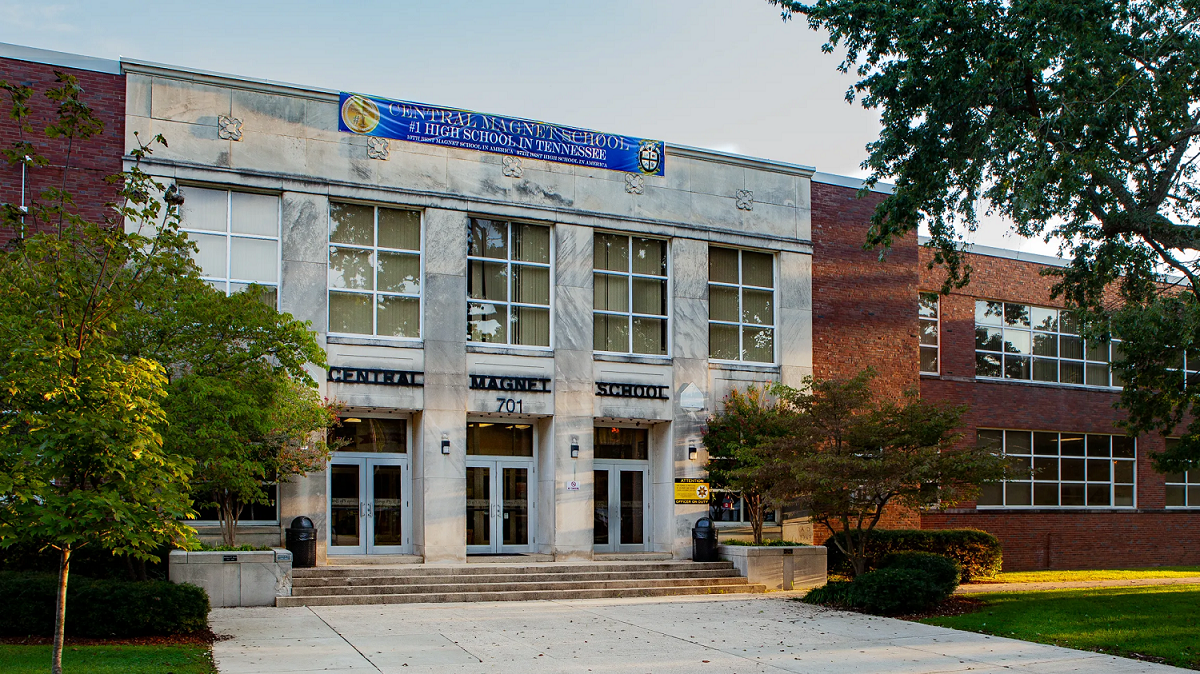
(Top image caption—the Central Magnet School in Rutherford County has Tennessee’s highest average ACT scores)
For over 10 years, Tennessee has administered the ACT to all high school juniors. Consequently, the state’s data is remarkably complete. In 2022, it was one of 6 states where an estimated 100% of graduates took the ACT; among these, it ranked second (with an average composite of 18.6). Of the states with 100% participation, Wyoming had the highest average score (19.2), and Nevada had the lowest (17.3).
Tennessee Scores in Context
To more fully contextualize this, it’s important to acknowledge that states with higher testing levels tend to have lower average scores. One main reason for this is that they include results from students whose future plans may not include college-level coursework. In states where standardized testing like the ACT is optional, test-takers are primarily a self-selecting, academically advanced cohort, which is reflected in their test scores.
Consider, for example, Massachusetts, which had one of the highest average ACT scores in the nation (26.5), but administered tests to only 9% of graduates. If we only look at the scores of the top 9% of Tennessee students, the average score is a 29.8. In other words, while the average Tennessee student may achieve a lower ACT score than many of their peers nationwide, Tennessee’s academically gifted more than hold their own.
It can also be useful to look at how a state compares to others in the same geographical region. Here, Tennessee holds up well: of the eight states which border it, only four had higher average scores and none of those tested 100% of graduates.
ACT College Readiness Benchmarks
The ACT’s “College Readiness Benchmarks” are the scores (out of 36) on the subject area tests that indicate a student’s chances of college success. The ACT believes that meeting the benchmarks for English, Reading, Mathematics, and Science gives a student a 50% chance of earning a B or higher or a 75% chance of getting a C or higher in a corresponding freshman-level college course. Unchanged since 2013, these benchmark scores and their college course equivalents are:
- English (English Composition) – 18
- Reading (Social Sciences) – 22
- Math (College Algebra) – 22
- Science (Biology) – 23
Since 2015, the ACT has also offered a College Readiness Benchmark for coursework in STEM (science, technology, engineering, and math), based on scores on the Math & Science subject area tests. Because college-level STEM coursework tends to be more academically challenging (for instance, many STEM freshmen begin with Calculus instead of Algebra), ACT has determined that the benchmark ACT score is significantly higher for STEM than in other subject areas. Meeting the STEM benchmark indicates a 50% chance of earning a B or higher in identified college-level STEM courses. The benchmark score is: Math & Science (STEM) – 26
Many Tennessee Juniors are Not College-Ready
Tennessee’s Class of 2022 lags behind the national average for students meeting ACT College Readiness Benchmarks (CRBs). Tennessee graduates are most college-ready in English, with about half (47%) of graduates meeting the CRB, but the numbers are significantly lower in other subject areas. One-third of students (33%) met the Reading benchmark, one-fourth are college-ready in Science (25%), and even fewer are ready in Math (22%).
Broadly speaking, 2022’s results continue a long-term trend of gradually decreasing college-readiness among Tennessee students. Seen in data from 2020 (above), the number of students who failed to meet CRBs in all subject areas has risen about 5% over the past decade, though the progress has not always been linear.
This seems to be due primarily to improvement on the English section of the ACT; in 2020, 53% of Tennessee seniors met the CRB, up from 52.4% in 2019. Sadly, performance since then fell along with the other three sections, most dramatically in Math (27.3% in 2019 down to 22% in 2022).
Tennessee’s Racial & Economic Achievement Gaps
Nationally, there is a concerning correlation between a student’s racial background and their likelihood of. In general, Asian Americans have the highest rates of success, followed by white students. Students who identify as Black or African American score the lowest (Hispanic students, and students of other races, score somewhere in the middle.) It is important to emphasize that this is not a causative relationship. Black students do not score worse than white students, on average, because they are Black; rather, it is that many factors which negatively impact ACT scores tend to disproportionately affect non-white (and non-Asian) students.
Tennessee’s 2020 results reveal a similar racial achievement gap, but one which is somewhat smaller than the national trend. Nationwide, the gap between the composite ACT scores of the highest- and lowest-scoring groups of students is over 8.2 points; in Tennessee it is 7.3 points.
Closing the achievement gap will take hard work, but it is an attainable goal. For instance, if Tennessee wanted to achieve parity in college readiness between white and Black students, they would only need to improve the scores of about 3,300 Black students.
In addition to race, a student’s economic status is often closely related to their ACT performance. Nationwide, the achievement gap between students whose family income is less than $36,000 a year (classified as “low income”) and those whose family income exceeds that amount is very wide: when comparing students who meet 3 or more CRBs, over 20 percentage points separate the two groups. In Tennessee this gap is notably smaller—around 13 percentage points—but still shows room for improvement.
How to Improve ACT Scores
Luckily for students of all racial and economic backgrounds looking to increase their chances of ACT success, there are several actions they can take which are statistically likely to improve their scores.
- Focus on schoolwork and take academically challenging classes. Students who do better in school nearly always do better overall on standardized tests like the ACT. For instance, 2020 Tennessee seniors who took a full four years of English scored an average of 7.5 points better on the English ACT than those who had taken less than four years of English classes.
- Take the ACT more than once. There is a clear statistical advantage to retesting; in 2020, Tennessee students who took the ACT two or more times were nearly five times more likely to meet all four college readiness benchmarks, compared to those who took the test only once. The state of Tennesee has also developed an innovative ACT Senior Retake program in 2016, in which public school students retake the ACT in the fall of their senior year. Students not in Tennessee or ready for their second retake that are worried about the cost of retesting should consider ACT’s fee waiver program, which allows eligible students to test for free.
- Spend time studying and preparing specifically for the ACT. Taking practice tests helps students familiarize themselves with the content and the format of the test and gives them specific feedback. In addition, working with a tutor can be an effective way of improving a student’s weakest areas and developing test-taking strategies. Piqosity offers a full suite of free ACT Practice materials and analyses of previously-released ACT tests, perfect for students wondering how to improve their ACT scores.
Tennessee’s Colleges are Popular and Affordable
It is difficult to say what most Tennessee graduates’ post-secondary aspirations are; nearly 60% of students declined to indicate their future educational plans. But of the students who did provide information, more than three-fourths are hoping to attain at least a four-year bachelor’s degree. If these college-bound students are anything like their peers from previous years, a majority will want to stay in the Volunteer State. The Class of 2019, for instance, sent about 57% of their ACT score reports to public in-state colleges; their top five selections were:
- University of Tennessee – Knoxville
- Middle Tennessee State University
- University of Tennessee – Chattanooga
- Tennessee Technological University
- University of Memphis
Admission to these schools is an attainable goal. For instance, at Middle Tennessee State University, a student will be guaranteed admission with a 3.0 GPA, an ACT composite score of 22, or:
- a GPA of 2.7 and
- an ACT Composite Score of 19
(For reference, in 2020 a majority of students at 200 Tennessee high schools met or exceeded this ACT score.)
Scoring very well on the ACT opens up certain academic scholarships at Tennessee schools. At the University of Memphis, for example, a student will be considered for merit-based aid if they have achieved:
- a GPA of 3.0 and
- an ACT Composite Score of 25
(This is a much higher bar to clear; only 15% of 2020 graduates met or exceeded this ACT score.)
Regardless of where students end up, Tennessee colleges are well within the financial reach of many students—for instance, all of the five schools listed above rank within the Top 20 Most Affordable Colleges at which to obtain a bachelor’s degree.
Additionally, through the Tennessee Promise program, every Tennessee graduate is eligible for two years of FREE tuition to any of Tennessee’s community colleges or colleges of applied technology (and even some four-year institutions). The only requirement is that the student must have lived in the state of Tennessee for at least one year; there are no income or GPA requirements.
The Top Tennessee High Schools by ACT Scores
The table below presents 2020 ACT Scores from 362 Tennessee high schools for which full data was available. Explore the original data from the Tennessee Department of Education here. (Two schools tied for 8th place; both are listed. See subject scores breakdown and number tested for further delineation.)
Top 10 Tennessee High Schools by 2020 Average ACT Scores (composite)
- Central Magnet School (30.5)
- Merrol Hyde Magnet School (29.8)
- Hume-Fogg Magnet High School (27.2)
- Middle College at Austin Peay SU (27.0)
- Brentwood High School (26.9)
- Renaissance High School (26.6)
- Ravenwood High School (26.3)
- Martin Luther King Jr. School (26.0) & Franklin High School (26.0)
- Fred J Page High School (25.3)
- Hamilton County Collegiate High at Chattanooga State (25.0)
How to Read This Sortable Table
- The default sort is by composite score from highest to lowest; to change the sorting order, click on the header by which you want to sort
- “Avg Score” is the composite ACT score from 0 to 36
- “English, Reading, Math, Science” refers to the school’s average scores in each subject test from 0 to 36
- “# Tested” refers to the number of students who sat for the test at each school
Tennessee ACT Scores 2023
| wdt_ID | School Name | District Name | Avg Composite | Avg English | Avg Math | Avg Reading | Avg Science | # Tested |
|---|---|---|---|---|---|---|---|---|
| 1 | Anderson County High School | Anderson County | 18.90 | 18.00 | 18.20 | 19.50 | 19.10 | 249 |
| 2 | Anderson County Innovation Academy | Anderson County | 18.50 | 18.10 | 17.40 | 20.50 | 17.90 | 11 |
| 3 | Clinton High School | Anderson County | 18.70 | 17.70 | 18.20 | 19.60 | 18.90 | 249 |
| 4 | Oak Ridge High School | Oak Ridge | 21.70 | 20.90 | 20.80 | 22.70 | 21.70 | 316 |
| 5 | Cascade High School | Bedford County | 19.30 | 19.10 | 18.80 | 19.40 | 19.20 | 121 |
| 6 | Shelbyville Central High School | Bedford County | 17.50 | 16.20 | 17.40 | 17.90 | 17.90 | 269 |
| 7 | Community High School | Bedford County | 18.40 | 17.30 | 18.00 | 19.00 | 18.70 | 107 |
| 8 | Big Sandy School | Benton County | 19.60 | 18.60 | 18.70 | 20.50 | 19.70 | 15 |
| 9 | Camden Central High School | Benton County | 19.40 | 18.70 | 18.40 | 20.20 | 19.90 | 119 |
| 10 | Bledsoe County High School | Bledsoe County | 17.10 | 16.30 | 16.70 | 17.70 | 17.30 | 99 |
| 11 | Heritage High School | Blount County | 18.40 | 17.90 | 17.70 | 19.10 | 18.60 | 309 |
| 12 | Samuel Everett School of Innovation | Blount County | 18.70 | 18.30 | 17.00 | 19.90 | 18.90 | 31 |
| 13 | William Blount High School | Blount County | 19.30 | 18.90 | 18.80 | 19.90 | 19.20 | 339 |
| 14 | Alcoa High School | Alcoa | 20.40 | 20.10 | 19.20 | 21.20 | 20.40 | 165 |
| 15 | Maryville High School | Maryville | 22.70 | 22.30 | 22.40 | 22.80 | 22.80 | 378 |
| 16 | Bradley Central High School | Bradley County | 17.70 | 16.70 | 17.40 | 18.10 | 18.00 | 349 |
| 17 | North Cleveland GOAL Academy | Bradley County | 13.70 | 12.30 | 14.30 | 13.50 | 14.00 | 23 |
| 18 | Walker Valley High School | Bradley County | 20.60 | 20.20 | 19.70 | 21.50 | 20.50 | 348 |
| 19 | Bradley County Virtual School | Bradley County | 16.80 | 15.60 | 15.50 | 18.30 | 17.10 | 41 |
| 20 | Cleveland High | Cleveland | 18.30 | 17.30 | 17.70 | 19.20 | 18.50 | 360 |
| 21 | Campbell County Comprehensive High School | Campbell County | 17.20 | 15.80 | 16.90 | 17.90 | 17.60 | 265 |
| 22 | Jellico High School | Campbell County | 16.80 | 15.60 | 16.60 | 16.50 | 17.50 | 69 |
| 23 | Cannon County High School | Cannon County | 18.00 | 16.90 | 17.30 | 18.90 | 18.30 | 115 |
| 24 | Central High School | Hollow Rock - Bruceton | 16.20 | 14.50 | 16.10 | 16.20 | 17.30 | 41 |
| 25 | Huntingdon High School | Huntingdon Special School District | 18.40 | 18.00 | 17.30 | 19.50 | 18.30 | 95 |
| School Name | District Name | Avg Composite | Avg English | Avg Math | Avg Reading | Avg Science | # Tested |
Get Prepared for the ACT with Piqosity
If you’re a student preparing for the ACT and looking for ways to improve your test readiness, Piqosity is here to help! Piqosity is a simple, all-in-one learning platform for students who want to score better on their ACT in less time. Our tools monitor your progress to tell you exactly what you need to practice to reach your desired score.
We offer a full suite of ACT test prep materials: 10 full-length ACT practice tests, over 70 distinct concept lessons, personalized practice software, and much more.
The best part? You can try out all of Piqosity’s features with our free community account. When you’re ready to upgrade, Piqosity’s year-long accounts start at only $89. Plus, get a 10% off coupon just by signing up for our mailing list!
For the full datasets referenced in this article:
- Average ACT Scores by State Graduating Class of 2022
- ACT Database for US ACT Score Trends in the Class of 2022
- 2022 ACT Scores for Tennessee High Schools
More Educational Resources from Piqosity:
